
On this page
Questions about your own assay?
Ask a specialistBoth formats follow binding label-free and in real time. The practical difference is the sample path: flow over a chip, or a tip dipped in a shaken well. Choose a closed flow path for slow off-rates. For crude samples and long sample lists, dip-and-read tips and plate-based flow both work. Confirm key affinity values on a second system.
Biolayer interferometry vs SPR: same readout, different sample path
Biolayer interferometry vs SPR is a common choice, and nanophotonic evanescent field sensing (NES) is a third option. All three are label-free biosensors that follow binding as it happens. One partner, the ligand, sits on a sensor surface. The other, the analyte, comes in from solution, and the signal grows as mass collects at the surface. The plot of signal over time is a sensorgram, and fitting it gives the binding rates and the affinity [1].
Surface plasmon resonance (SPR) flows the analyte over a gold-coated chip and reads binding as a shift in the angle of reflected light [1]. Biolayer interferometry (BLI) dips a fiber-optic tip into a well and reads binding as a shift in the interference pattern of white light reflected from the tip [1]. NES is close to SPR in principle: binding changes the refractive index inside an evanescent field. It reads that change with photonic ring resonators on a chip instead of a gold film, and that chip format lets one injection pass several sensing channels in series, a reference channel among them. The choice is less a question of what you measure than of how the sample gets to the sensor.
Integrated photonic sensors of this type detect binding without labels and lend themselves to multiplexed readout [2]. The NES page explains how photonic biosensing works in more detail.
What is the difference between SPR and BLI?
SPR keeps the sensor still and moves the sample through a closed channel, so runs can be long and tidy but a channel can clog. BLI moves the sensor through open, shaken wells, so crude samples and long sample lists are easy but the wells evaporate over a long run [7,4]. NES is also a flow format.
| Surface plasmon resonance (SPR) | Biolayer interferometry (BLI) | Nanophotonic evanescent field sensing (NES) | |
|---|---|---|---|
| How the sample meets the sensor | Continuous flow through microfluidic channels [1] | Tip dipped into a shaken microplate well [7,4] | Continuous flow over the chip. On inQuiQ, one injection passes 4 channels in series, one of them a reference |
| Slow off-rates | Closed flow path allows long dissociation phases [4] | Open wells evaporate, which limits run time [4] | Closed flow path, no evaporation |
| Crude samples | Channels and valves can clog [4] | No fluidics to clog; supernatant, serum and plasma can go in directly [7] | Antifouling surface supports serum and plasma; inQuiQ768 ranks clones from crude supernatant filtered through 0.22 µm |
| Label | None | None | None |
| Watch-outs for SPR and BLI | Immobilization can change the ligand, regeneration needs optimizing, non-specific binding and mass transport need controls [1,3] | Same controls as SPR; the reference channel sits in the same flow path and sees the same injection | |
Slow off-rates favor a closed flow path
A tight binder often owes its affinity to a slow off-rate. A koff of 0.0001 1/s means about 0.01% of the complexes fall apart every second, so after 30 minutes 84% are still bound. To fit that koff, the decay has to rise clearly above baseline drift, which takes long dissociation phases.
In a head-to-head study, ten high-affinity antibodies were measured against the same antigen on three SPR instruments and one BLI instrument, with the same reagents [4]. The rank order agreed, but the flow instruments resolved the slow off-rates better. The BLI data drifted upward during dissociation, which the authors linked mainly to evaporation from the open plate [4]. NES was not part of that study, but it is also a flow format. On inQuiQ, baseline drift is typically below 0.3 RU/min and kd is measurable down to 10-6 s-1, so long dissociation phases stay usable; see measuring tight binders.
Evaporation also caps run time. The dip-and-read runs were kept under 12 hours, with 30 minutes of dissociation against 45 minutes on the flow instruments [4]. In an open well, released analyte also lingers around the tip and distorts the fitted rate constants [3].
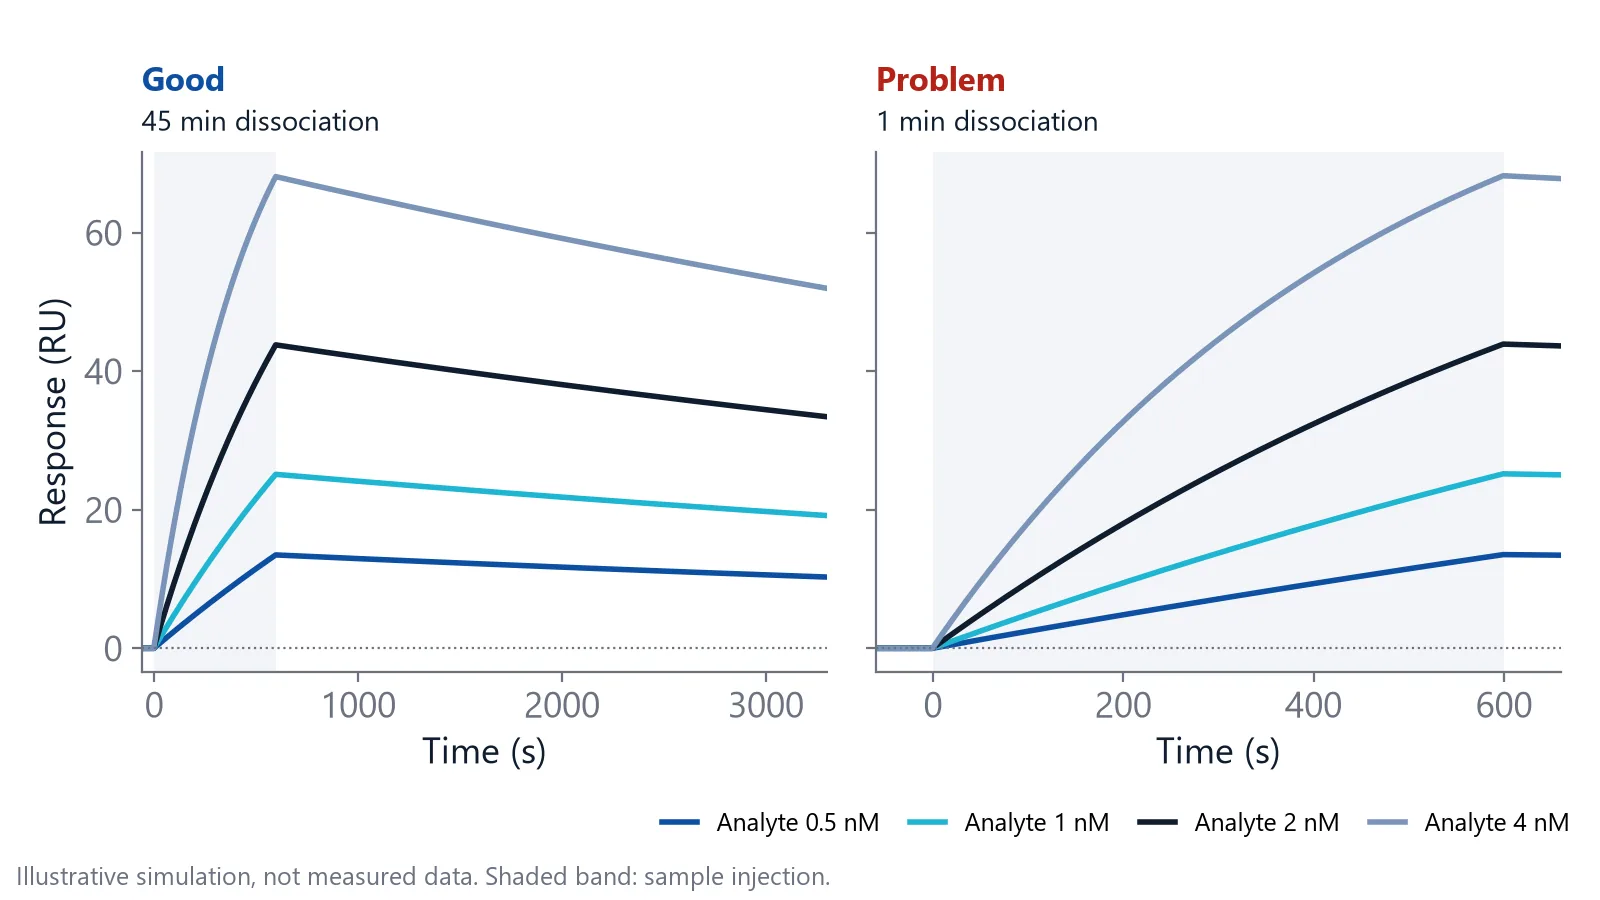
If your binders sit near 0.0001 1/s or slower, choose a closed flow path and run dissociation for 30 to 60 minutes or longer.
Crude samples and long sample lists: tips or plate-based flow
Dip-and-read sensors can measure directly in cell culture supernatant, serum or plasma, without purification [7]. Pre-coated tips, such as an anti-Fc capture surface, skip the immobilization step [4]. Capture chips such as Protein A or G do the same job in flow: the ligand is captured, not coupled.
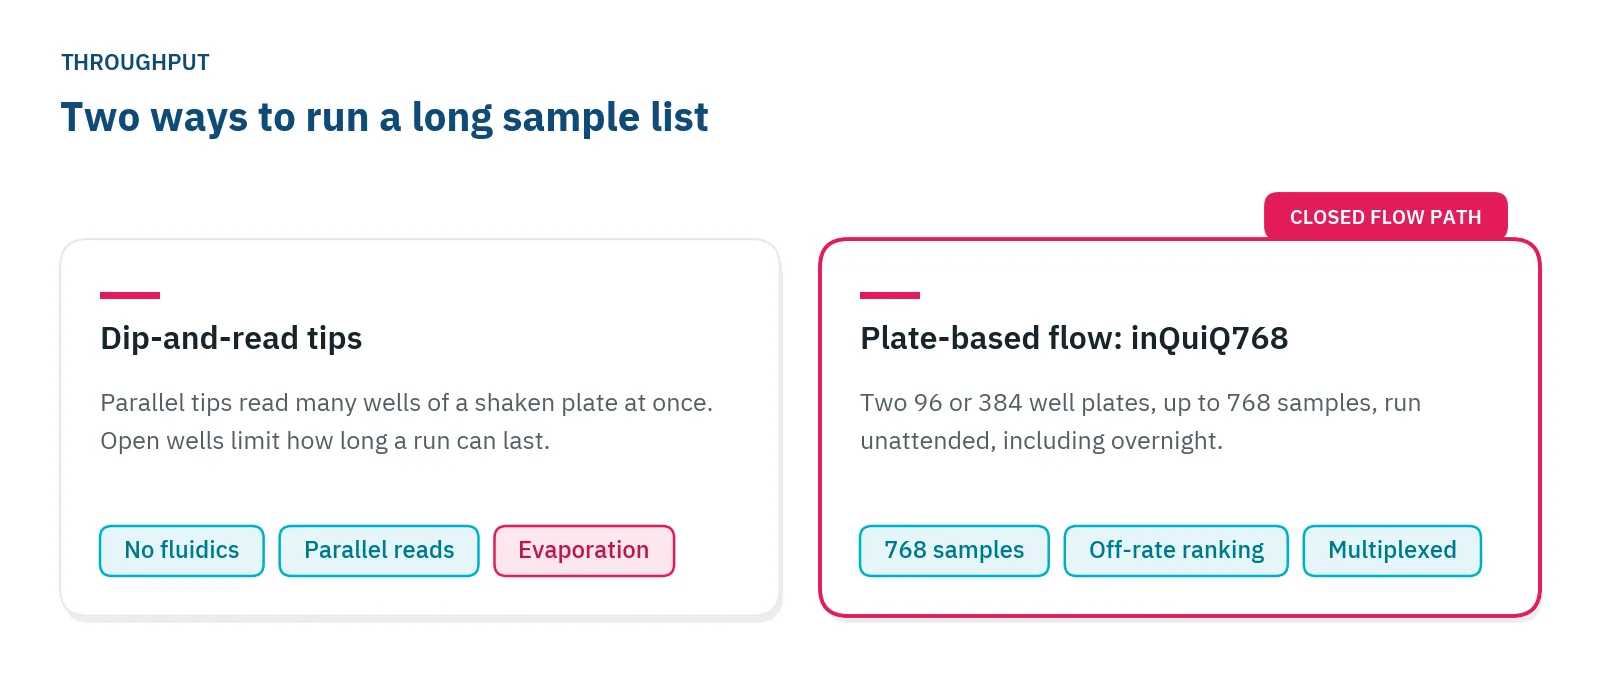
Parallel tips also save time. In the same antibody comparison, the dip-and-read instrument read 16 interactions at once, and the platforms that read in parallel each finished the ten antibodies in a day [4]. Flow scales too. inQuiQ768 takes two 96 or 384 well plates, runs up to 768 samples unattended, including overnight, and ranks antibody clones by off-rate straight from crude supernatant filtered through 0.22 µm, with a reference and up to three ligand channels per injection.
On inQuiQ, an antifouling hydrogel surface limits non-specific binding and supports measurements in serum and plasma; see binding analysis in serum and plasma. As with any flow system, spin or filter out particulates first.
Which method handles small molecules?
In SPR, BLI and NES alike, signal scales with the bound mass, so small analytes give small responses. SPR is an established tool for fragment screening, with kinetics resolved from responses of about 1 RU [5].
For a 1:1 interaction, divide the analyte mass by the ligand mass and multiply by the ligand level on the surface: that is the most signal you can expect. Check that your instrument's noise and drift sit well below it, then run a pilot with a known binder before you screen. inQuiQ has no lower molecular weight limit, and the small molecule interactions app note shows a 250 Da compound binding to carbonic anhydrase II. More on this use case: small molecule binding affinity.
Mass transport and referencing apply to both formats
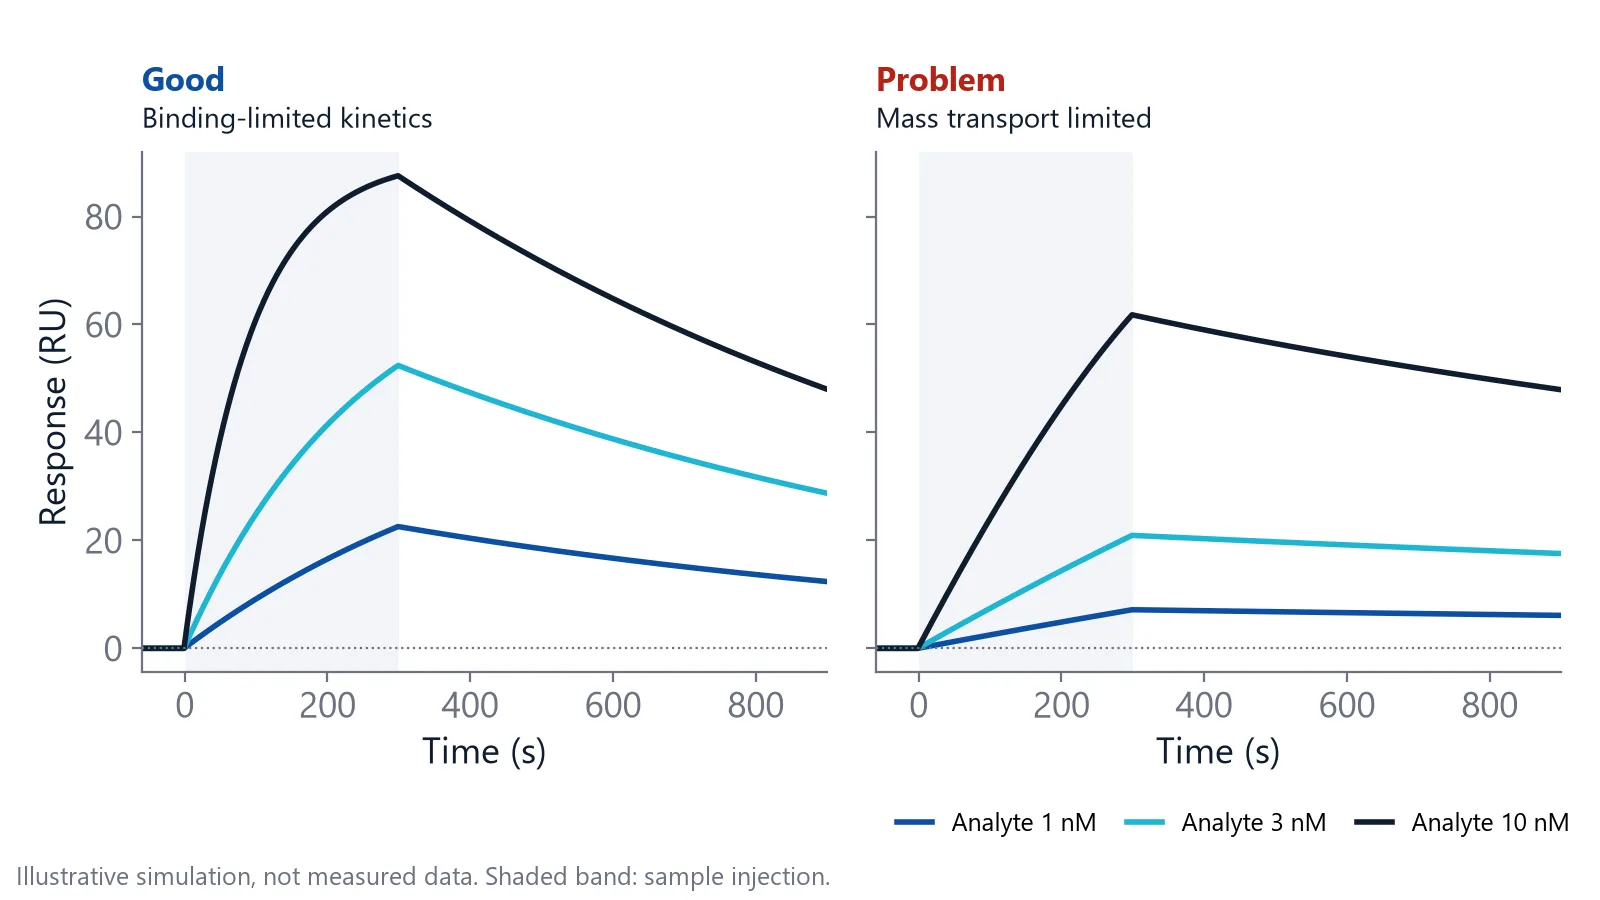
Two artifacts follow you whichever format you pick. The first is mass transport. When the ligand captures analyte faster than diffusion brings it in, the curves report delivery rather than the interaction, and the fitted rates are wrong [3]. In any format, keep the ligand level low enough that delivery does not limit binding [4].
To test for it, repeat the experiment at two ligand densities. If the rates stay the same, transport is not limiting. If they change, transport is the likely cause, though a crowded or uneven surface can do the same [3].
The second is the bulk signal. In SPR, anything that changes the refractive index near the sensor adds signal, including a small buffer mismatch [3]. NES shares that principle. On inQuiQ, the reference channel sits in the same serial flow path as the ligand channels, so the reference is subtracted from the same injection. Correct for it in every format:
- Subtract a reference surface or sensor without ligand, which also removes minor non-specific binding [3]
- Subtract buffer-only injections or wells run close in time to your samples [3]
- Match the sample buffer to the running buffer
Do SPR and BLI give the same KD?
Not always: when several label-free systems measured the same thrombin aptamers, both the kinetic constants and the ranking of the aptamers depended on the system and on the user [6]. A KD belongs to one system and one assay, and that holds for NES as much as for SPR and BLI.
The capture surface is a common cause. In the antibody study above, the dip-and-read tips held the antibodies by anti-Fc capture while the flow instruments used protein A/G. The authors suggest the weaker protein A/G capture may have made off-rates look faster [4]. If you run an antibody campaign, see antibody affinity and kinetics for typical setups.
- Use the same capture chemistry when you compare methods
- Report the method, surface and temperature with every KD
- Confirm lead values on a second system, as the aptamer study recommends [6]
Choose by your hardest measurement
In biolayer interferometry vs SPR vs NES, pick the format that handles the most difficult part of your project, and accept its trade-offs elsewhere.
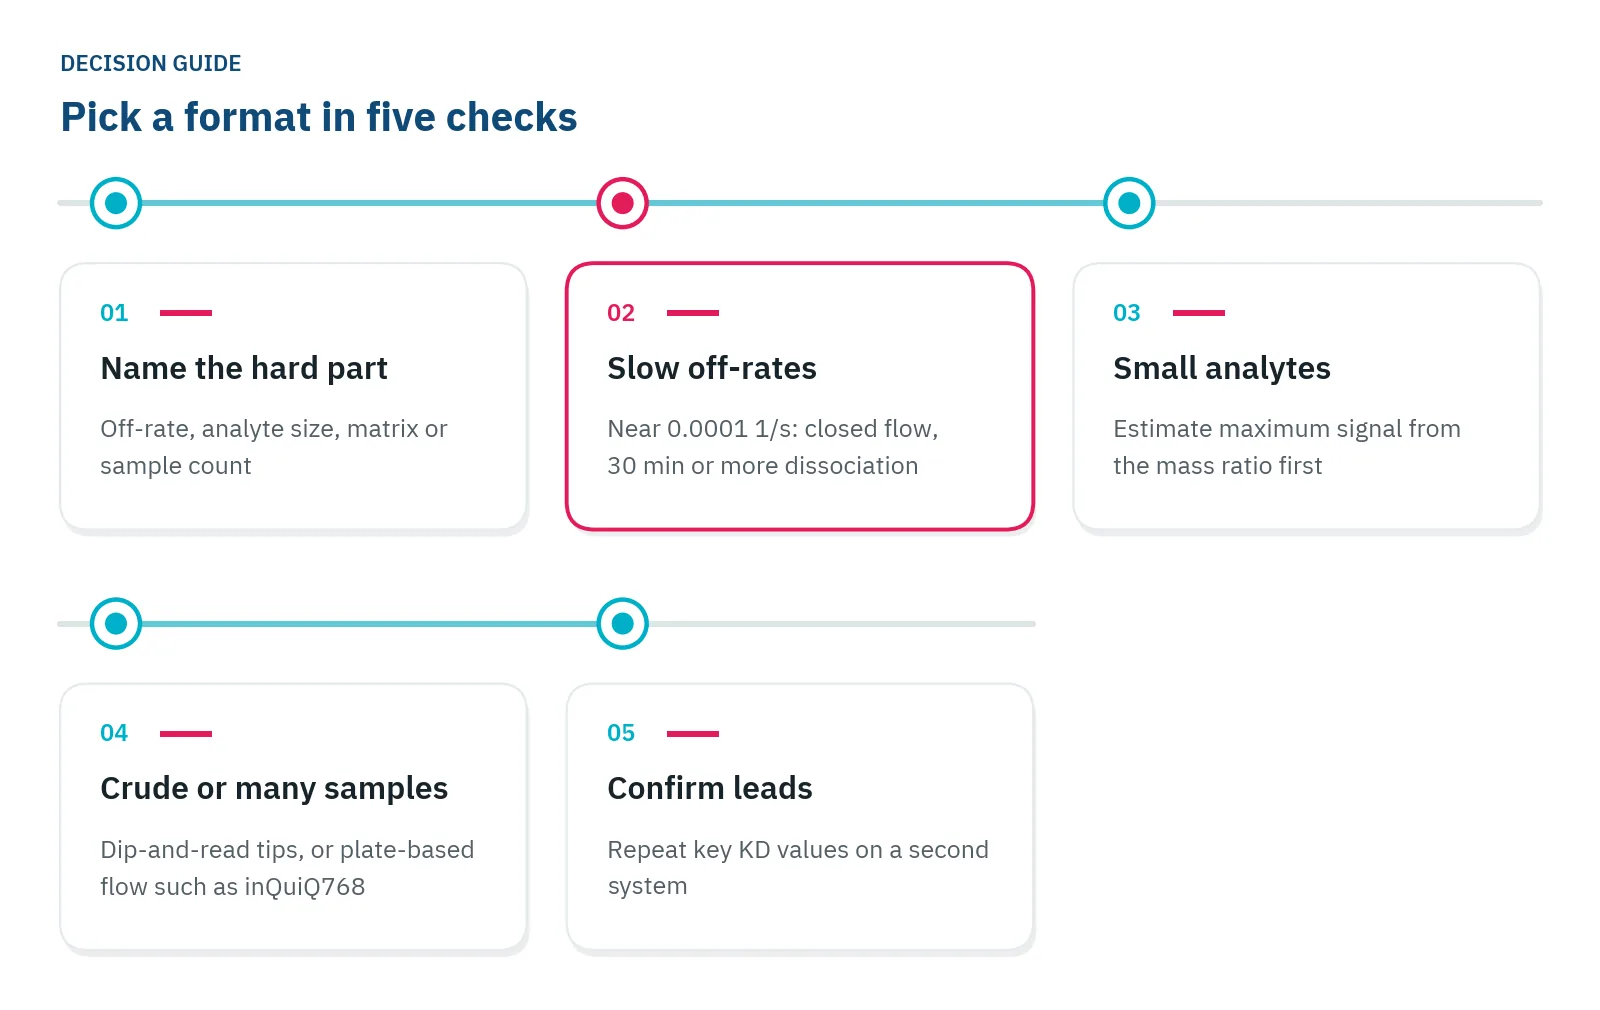
A screen of hundreds of unpurified supernatants and a careful koff for three lead antibodies are different jobs. You can triage in one format and finish in the other, which also gives you the second system for your key values, for example a plate screen on inQuiQ768, then careful koff runs on the leads. Framed that way, biolayer interferometry vs SPR or NES is rarely an either-or choice.
Questions researchers ask
Do dip-and-read tips and flow chips both need regeneration?
Both can be regenerated. Capture tips are often regenerated and reused a limited number of times [[ref:7]], or you can take a fresh tip per sample to skip regeneration, at the cost of some tip-to-tip variation. Flow chips are usually regenerated between cycles. Scout for a solution that strips the analyte without damaging the ligand.
Can both formats run epitope binning?
Yes. Epitope binning asks whether two antibodies block each other on the antigen: bind the first, then add the second and see whether it still binds. Dip-and-read instruments move the tip from well to well. Flow instruments inject the two antibodies one after the other; on inQuiQ, serial flow runs both steps within one injection.
Can I move an assay from a dip-and-read to a flow instrument unchanged?
Rarely. Keep the ligand, capture chemistry and buffer, but expect to optimize ligand density, contact times and regeneration again, and re-check the reference surface and bulk correction. Run one well-known interaction on both instruments first, so differences in KD are not blamed on your molecules.
References
- Murali S, Rustandi RR, Zheng X et al.. Applications of Surface Plasmon Resonance and Biolayer Interferometry for Virus-Ligand Binding. Viruses. 2022. doi:10.3390/v14040717
- Butt MA, Imran Akca B, Mateos X. Integrated Photonic Biosensors: Enabling Next-Generation Lab-on-a-Chip Platforms. Nanomaterials (Basel). 2025. doi:10.3390/nano15100731
- Handbook of Surface Plasmon Resonance. The Royal Society of Chemistry. 2017. doi:10.1039/9781788010283
- Yang D, Singh A, Wu H et al.. Determination of High-affinity Antibody-antigen Binding Kinetics Using Four Biosensor Platforms. J Vis Exp. 2017. doi:10.3791/55659
- Karlsson R, Karlsson O, Belcher P. Fragment and Low Molecular Weight Compound Analysis. Handbook of Surface Plasmon Resonance. 2017. doi:10.1039/9781788010283-00255
- Rath C, Burger J, Norval L et al.. Comparison of different label-free imaging high-throughput biosensing systems for aptamer binding measurements using thrombin aptamers. Anal Biochem. 2019. doi:10.1016/j.ab.2019.05.012
- Apiyo DO. Biolayer Interferometry (Octet) for Label-free Biomolecular Interaction Sensing. Handbook of Surface Plasmon Resonance. 2017. doi:10.1039/9781788010283-00356
Keep reading
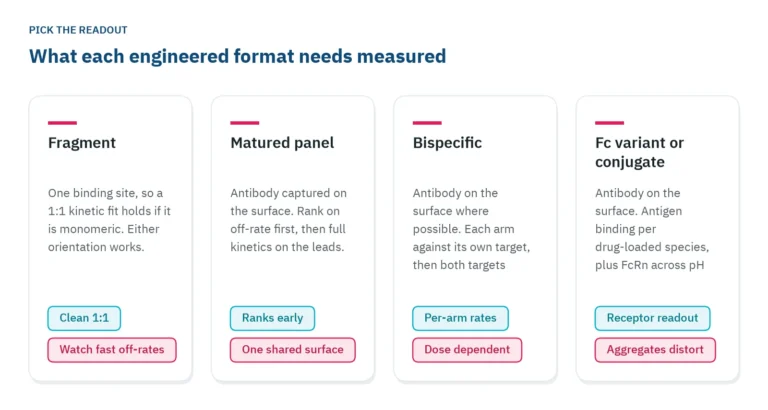 Antibody engineering: what binding data each format needsFragments, bispecifics, Fc variants and conjugates each need a different binding readout. Which parameter to measure, in which assay orientation, and why valency decides both.Applications
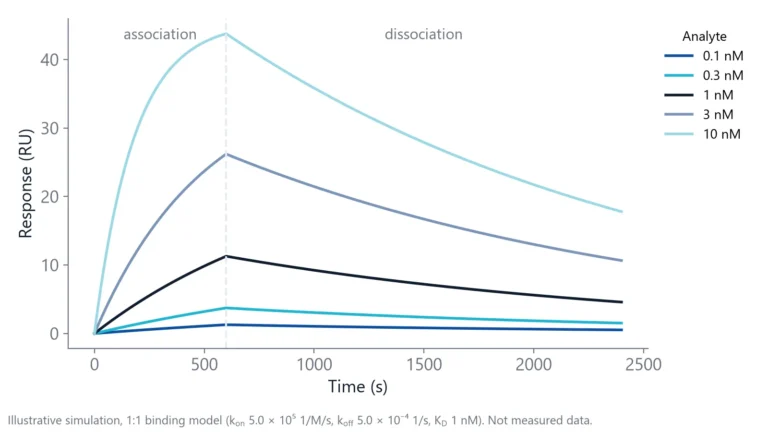 How to measure antibody binding kinetics: setup, rates and reportingA practical guide to antibody binding kinetics: which partner goes on the surface, how to set concentrations and times from the expected rates, how to check the fit and what to report.Switching from ELISA
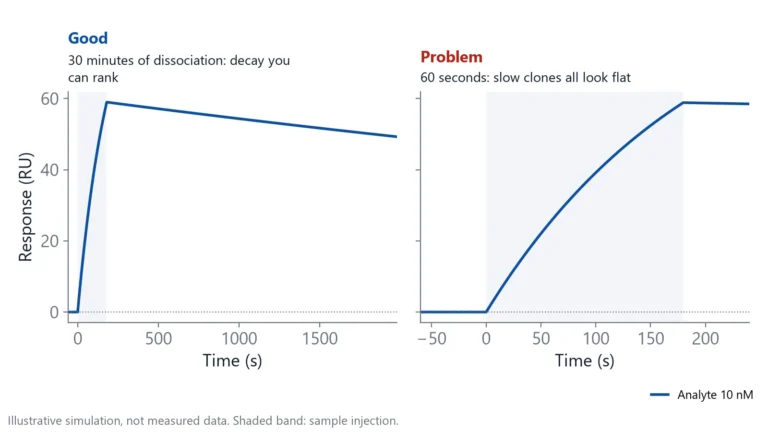 Antibody clone screening: from ELISA hits to off-rate rankingAn ELISA tells you which clones bind, not which ones hold on. How to rank hybridoma and library clones by off-rate straight from supernatant, and when ELISA is still the right first step.