
On this page
Questions about your own assay?
Ask a specialistA matrix effect is any change in your assay signal caused by sample components other than the analyte. In serum, proteins stick to the surface, the refractive index differs from buffer, and endogenous antibodies bind assay reagents. Test with spike recovery, dilution linearity and several serum lots, then reduce it with dilution, buffer matching, reference surfaces and low-fouling chemistry.
What a matrix effect means in a binding assay
A matrix effect is the combined influence of everything in a sample, other than the analyte, on the measured signal. In a binding assay run in serum, it can raise or lower the signal, cause drift, or create false positives [1]. The result is a concentration, KD or rate constant that differs from what you would measure in clean buffer.
Serum holds tens of milligrams of protein per milliliter, plus lipids, salts and the donor's own antibodies, while your analyte may be present at nanomolar or picomolar levels.
In LC-MS, the term usually means ion suppression or enhancement. In binding assays such as ELISA, surface plasmon resonance (SPR) and other label-free biosensors, the causes and the fixes are different. This article covers those.
What causes matrix effects in serum?
Matrix effects in serum have four main causes: proteins and lipids that stick to the sensor or plate surface, differences in refractive index between sample and buffer, endogenous antibodies that bind assay reagents, and binding proteins or autoantibodies that hide the analyte.
| Source | What you see | How to check | How to reduce |
|---|---|---|---|
| Non-specific adsorption (fouling) | Signal on control surfaces, slow drift, false positives [1,2] | Inject serum over a reference surface without ligand | Low-fouling surface, blockers, dilution |
| Bulk refractive index | A square step at the start and end of each injection in label-free assays [2] | The same step appears on the reference channel | Match buffer to sample, reference subtraction |
| Heterophilic antibodies, rheumatoid factor | Mostly false high signal in sandwich formats, rarely false low [3] | Nonlinear dilution, blocking reagents, a second method | Antibody fragments, blocking immunoglobulin |
| Binding proteins, autoantibodies | Low recovery when the analyte is masked; bias can go either way depending on format [3,4] | Spike recovery | Pre-treatment that releases the analyte |
Serum also differs from buffer in ionic strength, pH and viscosity. These can change the binding itself and how fast the analyte reaches the surface [1].
Matrix effect vs interference: what is the difference?
A matrix effect is the overall bias caused by the sample background, often before you know which component is responsible. Interference usually refers to a specific, identified substance, such as a heterophilic antibody, biotin or a cross-reacting molecule. In practice, you detect a matrix effect first and then look for the interfering substance behind it.
Interferents can be endogenous or exogenous, and the bias can go in either direction [3]. Heterophilic antibodies, for example, can bridge the capture and detection antibodies of a sandwich assay and create signal without any analyte present [3].
How matrix effects show up in ELISA and in label-free assays
In an ELISA, the matrix effect is hidden inside one endpoint number. Wash steps remove loosely bound material and only the labeled molecule gives signal, so fouling is less visible. Antibodies that bind the assay reagents act directly on the labeled antibody, and you only notice them when a result looks wrong.
Label-free methods measure all mass that arrives at the surface. Non-specific binding of matrix components adds to the signal, which a label-based method would not detect [2]. The real-time trace shows what is happening. A sharp step at injection start that disappears at injection end is a bulk refractive index effect. A slow rise on the reference channel is fouling. A curved association phase only on the active surface is binding.
A reference surface corrects much of this, but referencing works best when the specific signal is large compared with the non-specific signal [2]. Preventing a bulk step by matching buffers is better than correcting it afterwards [5].
How to test for a matrix effect
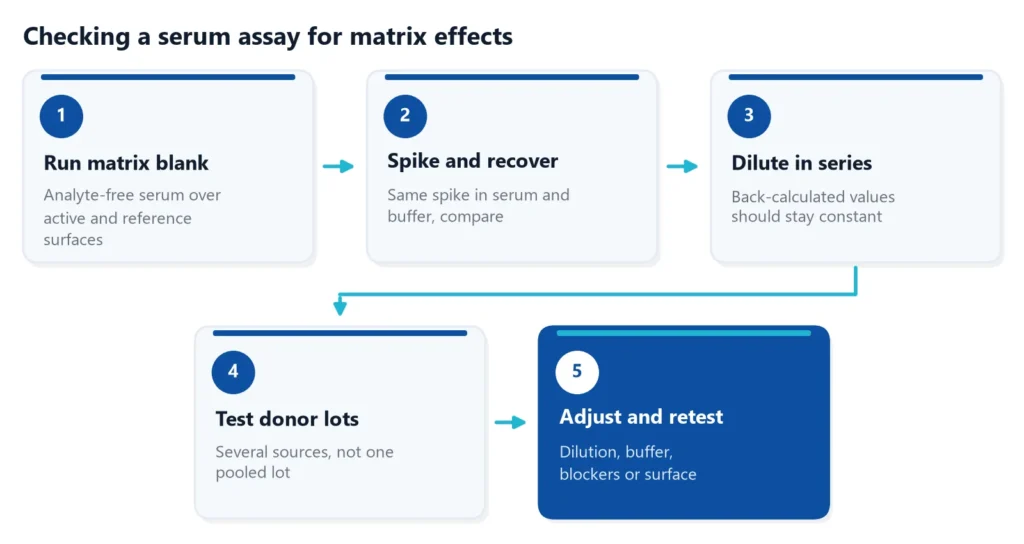
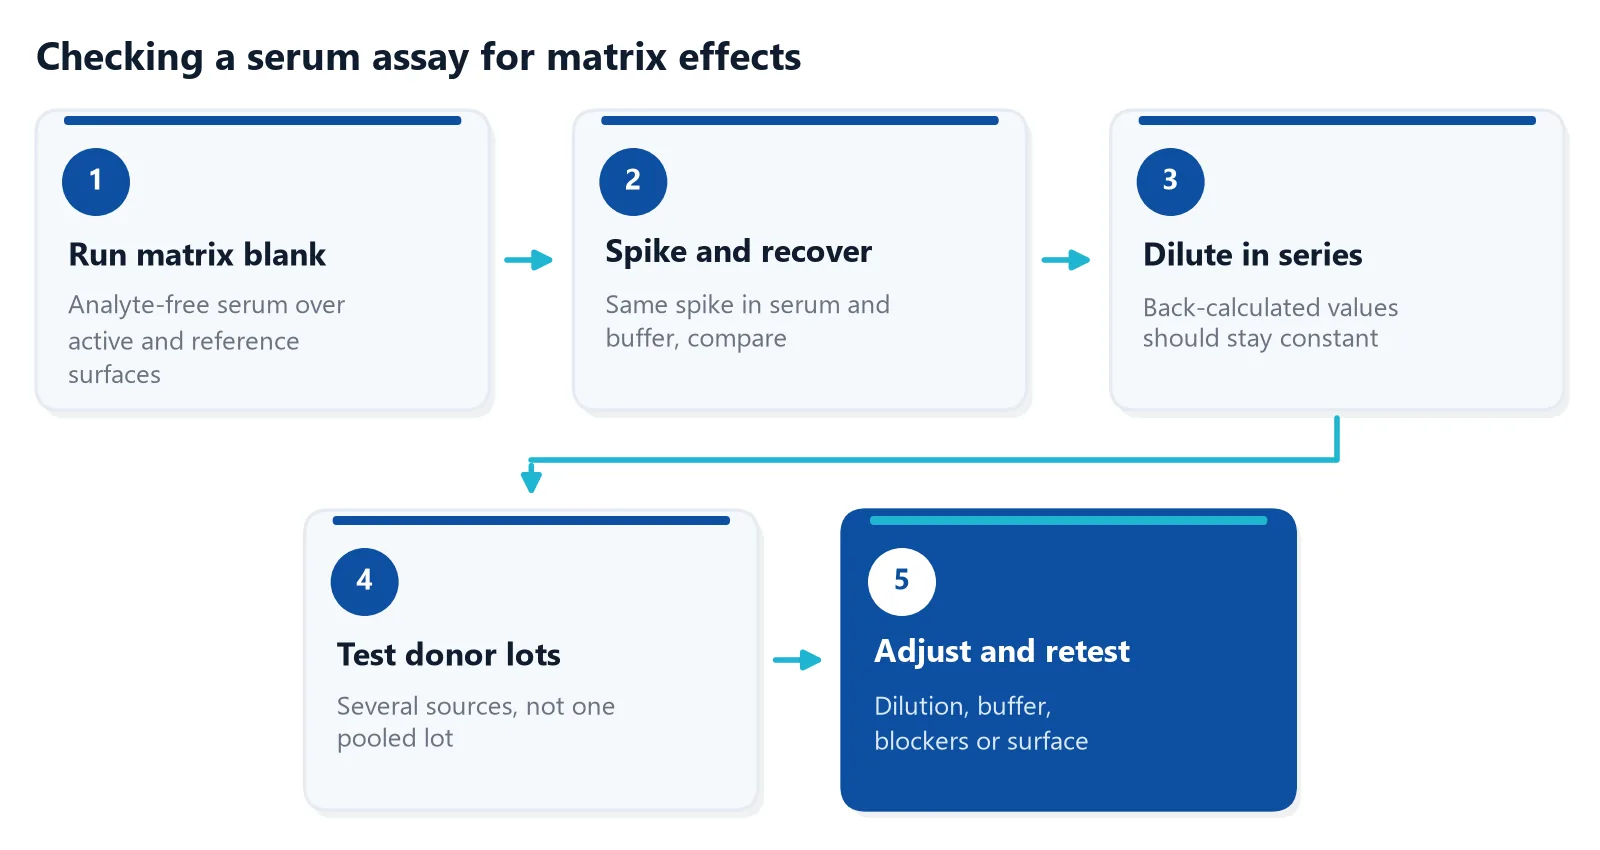
Run these checks before you measure study samples.
Start with a matrix blank: inject analyte-free serum over both the active surface and a reference surface (no ligand, or an inactive control protein) [7]. The referenced blank should be flat. Signal on the active surface only points to serum components that bind your ligand. If the blank gives signal, fix that first, because every later test depends on it.
- Matrix effect calculation: divide the signal in serum by the signal in buffer at the same analyte concentration and multiply by 100. A value of 100% means no effect, lower means suppression, higher means enhancement.
- Spike recovery: add a known amount of analyte to serum and compare the measured amount with the expected amount.
- Dilution linearity: dilute a high sample in series and check that the back-calculated concentrations agree.
- Several matrix lots: test serum from several donors, because fouling depends on the source of the sample [6].
For a sense of what passes, one validated serum ELISA reported dilution linearity of 95 to 115% and spike recovery of 81 to 109%, after the authors added a pre-treatment step to release the analyte from interfering binders [4]. For formal acceptance limits in regulated ligand binding assays, see the ICH M10 guideline.
Linear dilution is reassuring but not proof. Dilution linearity uses spiked samples, whereas parallelism checks real study samples with high analyte levels. Some samples with heterophilic antibodies still dilute linearly [3], and no single test rules interference in or out. In clinical immunoassays, three simple tests together (dilution, heterophile blocking tubes and PEG precipitation) were reported to identify interference in 90% of suspected samples [3].
How to reduce matrix effect in serum samples?
To reduce a matrix effect, dilute the serum as far as your sensitivity allows, match the running or assay buffer to the sample, add blockers or competitors for non-specific binding, use a low-fouling surface with a reference, and pre-treat samples when binding proteins hide the analyte.
Dilute and match buffers
Dilution can lower non-specific binding relative to the specific response, although it does not work for every source of non-specific binding [7]. Dilute samples and standards in the running buffer, and keep the buffer composition equal across the dilution series, so the bulk step stays small [5,7]. Dilution also lowers the analyte concentration, so it only works when the assay has sensitivity to spare.
Block and compete
Higher salt reduces electrostatic sticking, if the interaction tolerates it. On carboxymethyl dextran surfaces, soluble carboxymethyl dextran added to the sample competes with the surface for non-specific binders [7]. In one SPR study of autoantibodies, whole sera were diluted 1:5 in running buffer that contained carboxymethyl dextran [7]. Albumin can act as a blocker, and with patient serum, human serum albumin is the logical choice [5]. In sandwich formats, antibody fragments or non-immune animal immunoglobulin in the reagents reduce heterophilic interference, although no blocker removes it completely [3].
Choose the surface
Surface chemistry decides how much serum protein sticks. A zwitterionic polymer coating kept non-specific adsorption below 3 ng/cm² from undiluted human plasma, low enough to follow antibody and antigen kinetics directly in plasma by SPR [8]. Coatings that perform well in buffer do not always hold up in real biofluids, so test with your own samples [6]. For sample types and assay formats, see the overview of binding measurements in complex biological matrices.
Read the right part of the curve
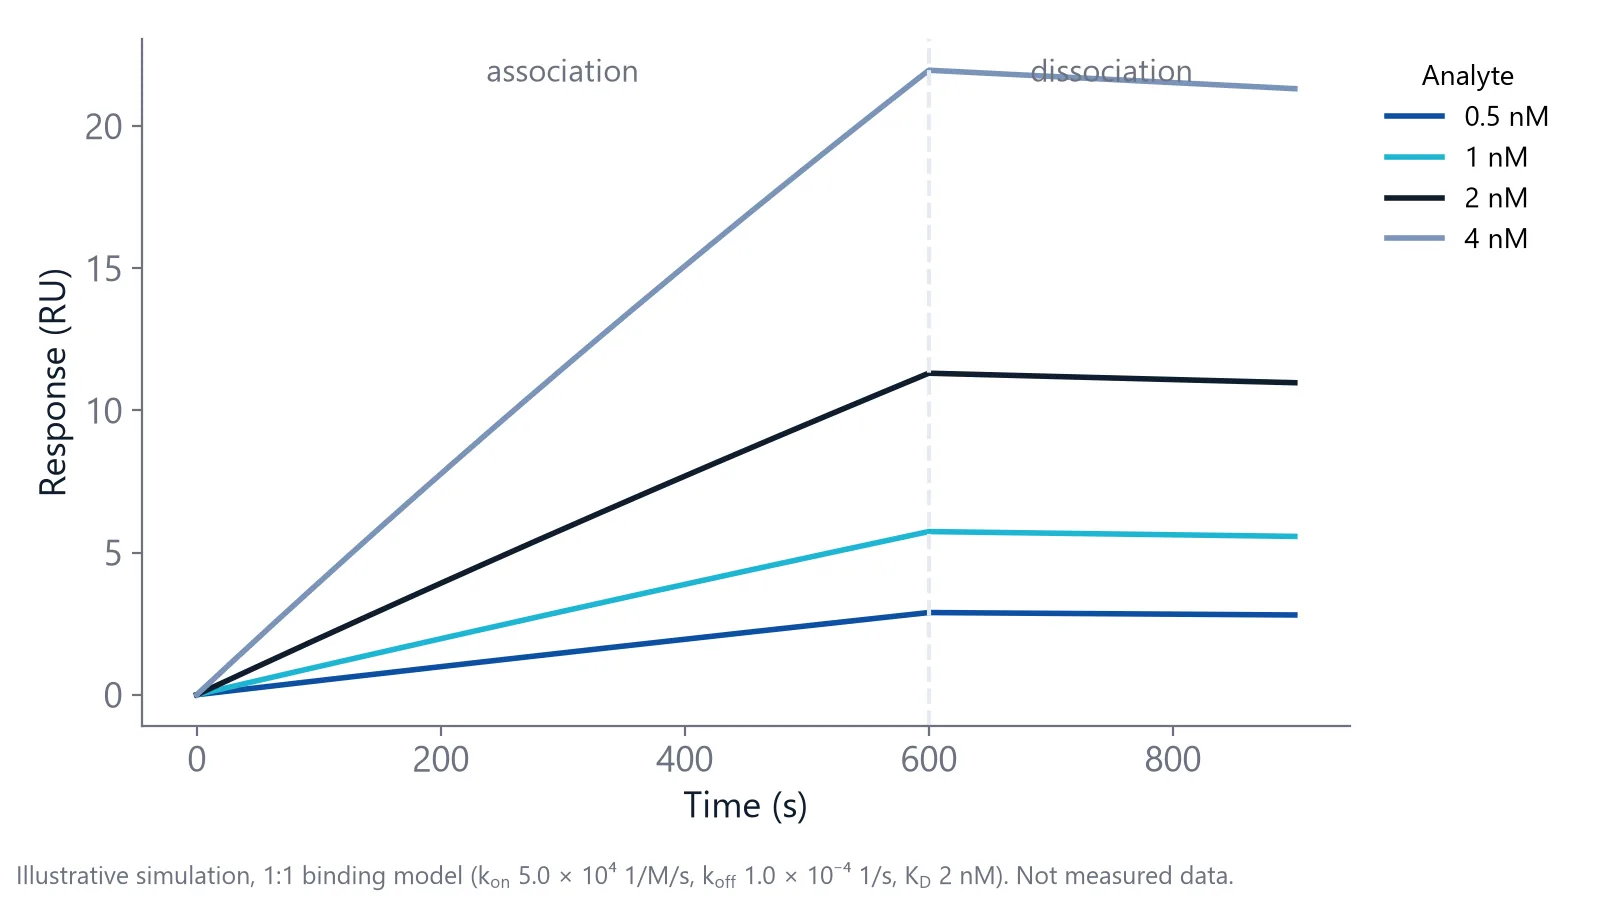
In a real-time assay, you can quantify from the early slope of the association phase, which rises with analyte concentration. With this initial-slope method, silicon photonic ring resonators measured a cancer biomarker in undiluted fetal bovine serum with a detection limit of 2 ng/mL, comparable to a commercial ELISA [9].
Measuring binding in serum with inQuiQ
The inQuiQ benchtop biosensor has an antifouling sensor surface, which supports measurements in complex matrices such as serum and plasma, and it needs a minimum sample volume of 30 µL. Delta's application note on biomarker detection in a complex clinical matrix shows this [10].
The tests in this article map onto one chip. The capture target, a matched reference surface and a control protein each get one of the 4 channels, and every serum dilution flows through all three in series in one injection.
Questions researchers ask
Is serum or plasma the better matrix for binding measurements?
Either can work. Plasma keeps fibrinogen and contains an anticoagulant, while serum has lost its clotting proteins. EDTA plasma removes divalent cations, which matters if your interaction needs calcium or magnesium. Choose one sample type, prepare standards in the same type, and do not mix serum and plasma within one study.
How much should I dilute serum before measuring?
There is no universal factor. Measure a high sample at several dilutions, for example 1:2 to 1:20. Choose the smallest dilution at which the back-calculated value has stopped changing (the minimum required dilution), and check that your analyte stays well above the detection limit. Dilute standards the same way.
What is the difference between matrix effect and recovery?
Matrix effect compares the signal of the same analyte amount in matrix and in clean buffer. Recovery compares the measured amount with the amount you added, so it also includes losses during sample preparation or binding to serum proteins. Report both numbers.
Can animal serum replace human serum for standards?
Animal or depleted serum is often used for matrix-matched standards when analyte-free human serum is not available. It differs in protein composition and antibodies, so it may foul or interfere in a different way. Confirm the choice with spike recovery in several human serum lots before you rely on it.
Does an antifouling surface remove the need for a reference channel?
A low-fouling surface reduces protein adsorption, but it does not replace a reference. Refractive index steps, temperature changes and any remaining adsorption still reach the sensor. A reference surface measured at the same time removes these shared signals. Keep the reference, and use a flat referenced blank with analyte-free serum as the check that the surface works with your matrix.
References
- Lenar N, Paczosa-Bator B. Why Sensors Fail in Biological Samples: Fouling, Blocking, Matrix Effects and Prevention Solutions. Int J Mol Sci. 2026. doi:10.3390/ijms27125176
- Handbook of Surface Plasmon Resonance. The Royal Society of Chemistry. 2017. doi:10.1039/9781788010283
- Ghazal K, Brabant S, Prie D et al.. Hormone Immunoassay Interference: A 2021 Update. Ann Lab Med. 2022. doi:10.3343/alm.2022.42.1.3
- Gadermaier E, Tesarz M, Wallwitz J et al.. Characterization of a sandwich ELISA for quantification of total human soluble neuropilin-1. J Clin Lab Anal. 2019. doi:10.1002/jcla.22944
- Schasfoort RBM. Introduction to Surface Plasmon Resonance. Handbook of Surface Plasmon Resonance. 2017. doi:10.1039/9781788010283-00001
- Blaszykowski C, Sheikh S, Thompson M. A survey of state-of-the-art surface chemistries to minimize fouling from human and animal biofluids. Biomater Sci. 2015. doi:10.1039/c5bm00085h
- Real-Time Analysis of Biomolecular Interactions. Springer Japan. 2000. doi:10.1007/978-4-431-66970-8
- Vaisocherová H, Yang W, Zhang Z et al.. Ultralow fouling and functionalizable surface chemistry based on a zwitterionic polymer enabling sensitive and specific protein detection in undiluted blood plasma. Anal Chem. 2008. doi:10.1021/ac8015888
- Washburn AL, Gunn LC, Bailey RC. Label-free quantitation of a cancer biomarker in complex media using silicon photonic microring resonators. Anal Chem. 2009. doi:10.1021/ac902006p
- Delta Life Science. Biomarker Detection in Complex Clinical Matrix. Application note. Link
Keep reading
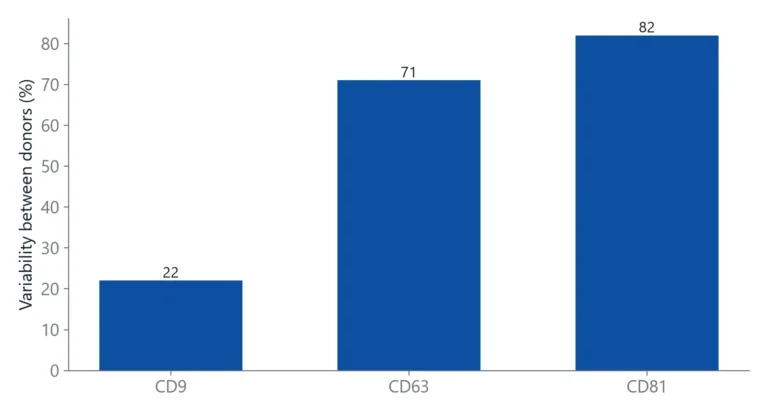 Tetraspanins CD9, CD63 and CD81: EV markers and binding targetsTetraspanins CD9, CD63 and CD81 are the standard handles for detecting and capturing extracellular vesicles. This article explains what they are, why they are not on every vesicle, and how to set up binding measurements around them.Applications
 How to measure nanobody binding affinity and kineticsNanobodies often bind in the nanomolar to picomolar range. This guide covers which method to use, how to avoid avidity and off-rate traps, and how to check that a nanobody KD is reliable.Assay setup
 Baseline drift in a biosensor: why it happens and how to stop itBaseline drift is often blamed on the chip. A short buffer-only test shows whether the surface, the buffer or the instrument is the real cause.