
On this page
Questions about your own assay?
Ask a specialistBaseline drift is a slow change in signal while only buffer flows. It usually comes from one of three places: a surface that is still settling or losing ligand, a buffer that does not match the sample or the system, or temperature and flow changes in the instrument. A short buffer-only test tells them apart.
What baseline drift is and why it matters
In a label-free biosensor, the baseline is the signal you record while only running buffer flows over the sensor. Baseline drift is a slow, steady rise or fall of that signal when nothing should be binding. Before the first analyte injection, a good baseline is close to flat [1].
Drift matters because the instrument cannot tell it apart from binding. Any slope present during an injection adds to the association and dissociation phases, and the fit reads part of it as kinetics. Most artifacts of this kind can be reduced by good experiment design and by referencing [2].
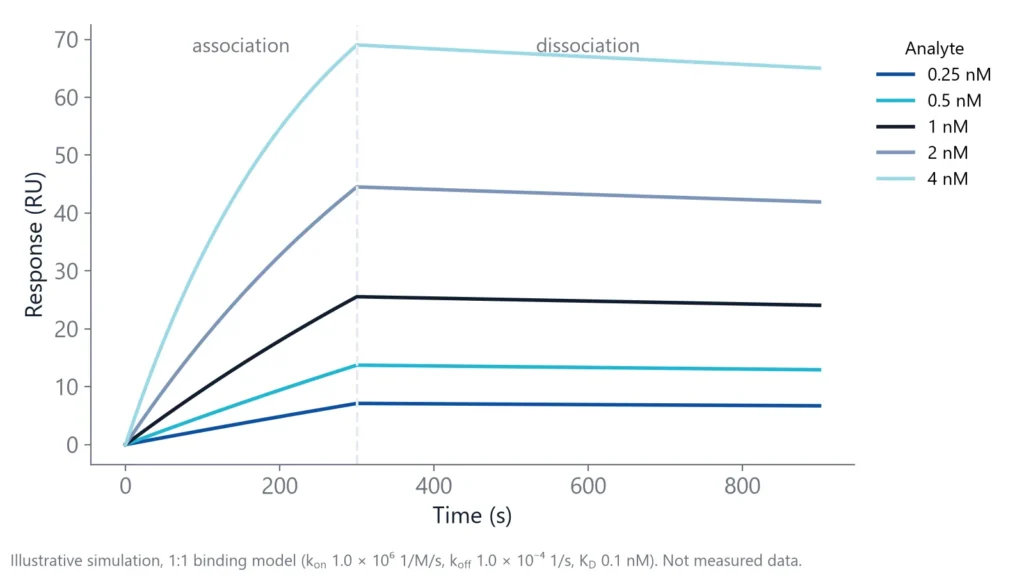
The effect is largest for slow off-rates. The simulation below shows an interaction with a kon of 1,000,000 1/M/s and a koff of 0.0001 1/s (KD 100 pM). During 10 minutes of dissociation, the top curve loses only about 4 RU, roughly 6% of its signal.
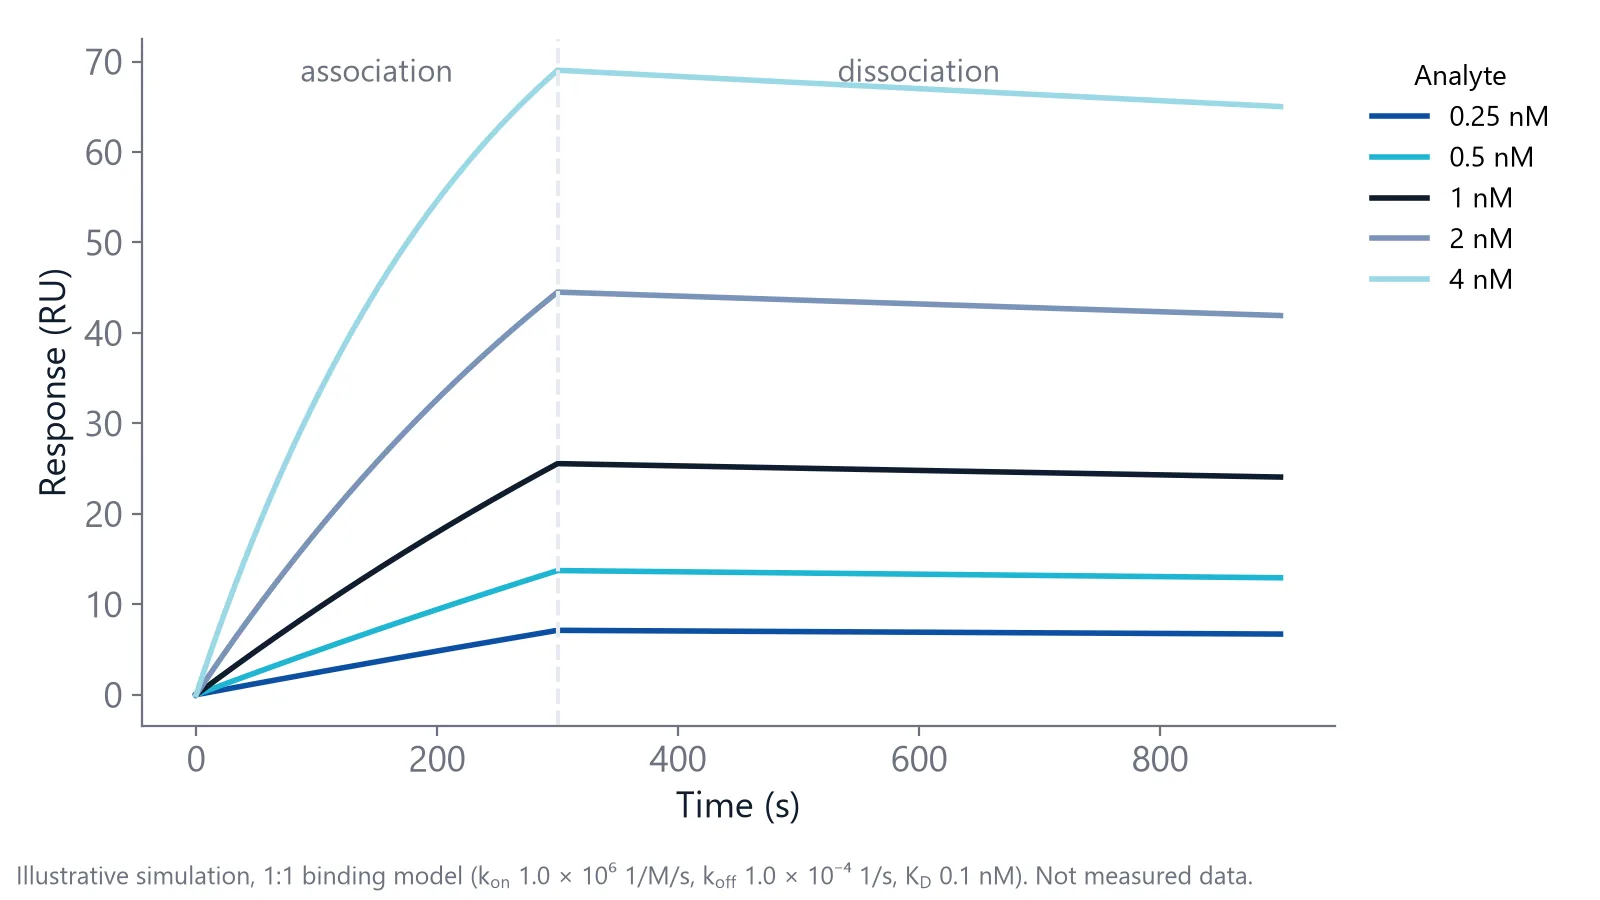
Now add a drift of 0.5 RU per minute. Over the same 10 minutes that is 5 RU, more than the real dissociation signal. Depending on the direction of the drift, the fit can return a koff that is far too fast or close to zero. For tight binders, a stable baseline is a condition for any koff you report.
What causes baseline drift in a label-free biosensor?
Baseline drift has three main sources. The sensor surface may still be equilibrating after immobilization or regeneration, or it may slowly lose captured ligand. The running buffer may differ from the buffer the surface last saw. Or the instrument may see changes in temperature or flow rate. Each source leaves a different pattern, so you can test for it.
The root cause is shared by all evanescent field sensors. They measure the refractive index in a thin layer, from tens to a few hundred nanometers above the surface [3]. Binding changes the index in that layer, but so does anything else. In a ring resonator, the change shows up as a shift of the resonance wavelength, and temperature fluctuations of the sensor add noise to that wavelength [3]. For the physics in more detail, see how photonic biosensing works.
- Surface: chemicals from immobilization or regeneration wash out slowly, and capture surfaces can release ligand over time [1,4]
- Buffer: a new buffer batch, a change in salt or DMSO, or pumps and tubing that still hold the old buffer [1]
- Instrument: a change in flow rate gives drift that levels out over 5 to 30 minutes, and temperature changes shift the optical signal [1,3]
A buffer-only test that separates the causes
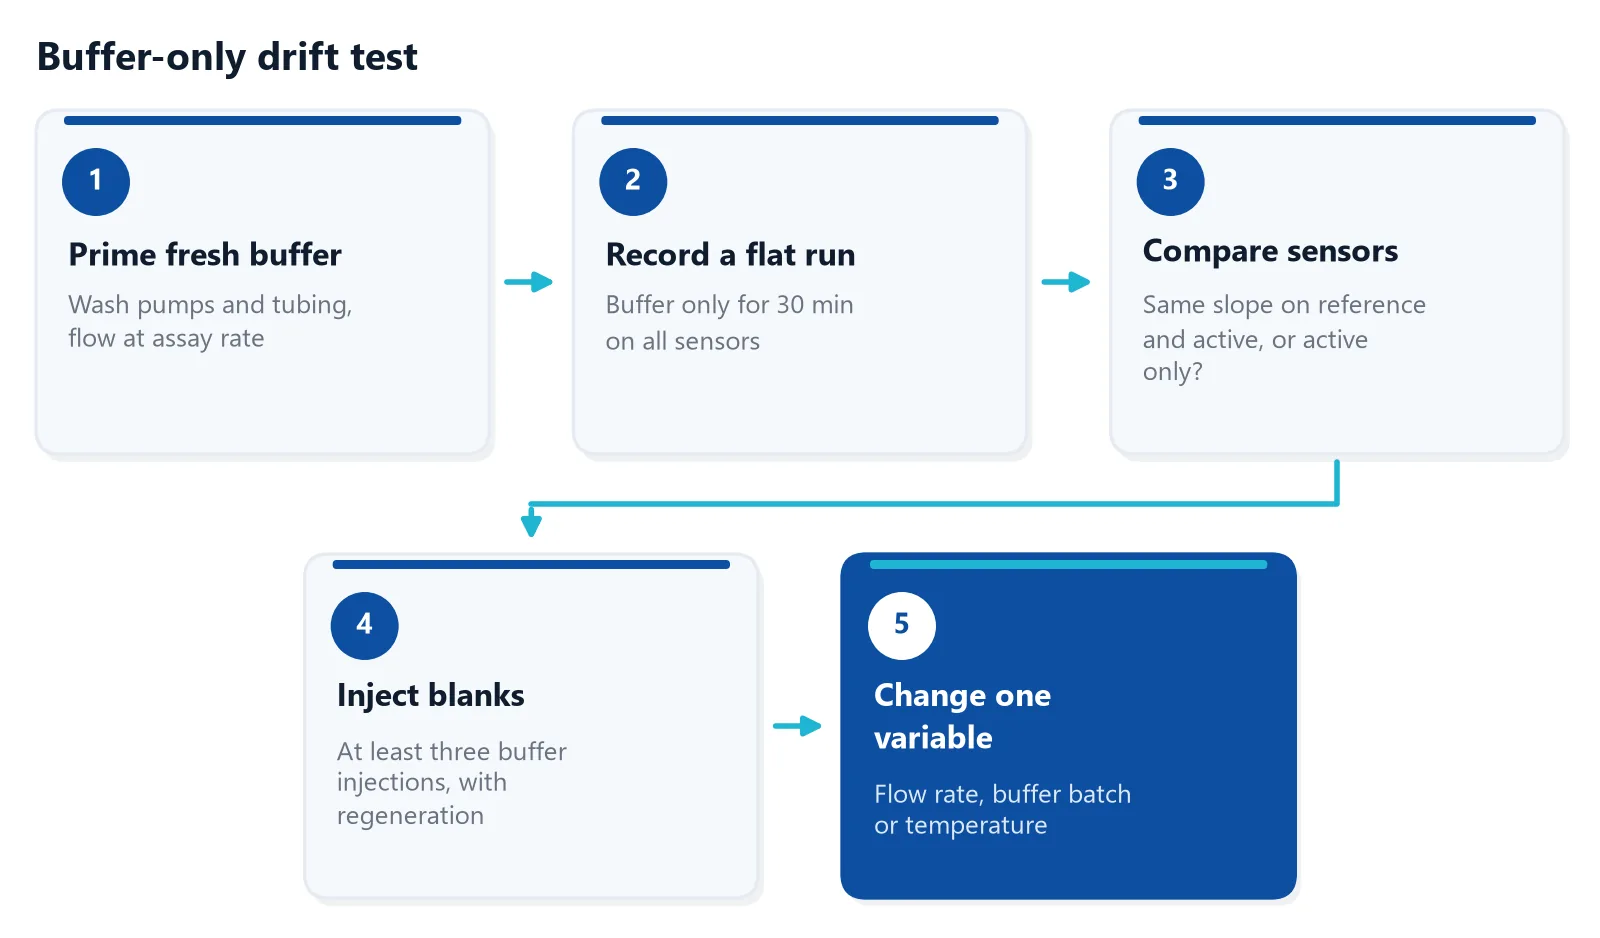
Before you replace the chip, run a short test with buffer only. It uses no sample and tells you where to look. The idea is simple: change one thing at a time and watch which sensors respond. Blank injections at the start of a run also show whether the system is fully equilibrated [1].
Reading the result
- Same slope on active and reference sensors: buffer or instrument. Referencing removes most of it, but check buffer and temperature first
- Slope on the active sensor only: surface. The ligand is leaching, or the surface has not finished equilibrating
- Drift that fades after each regeneration or flow change: equilibration. Add warm-up cycles and longer stabilization
- Steps and spikes instead of a slope: air or particles in the flow path. Filter and degas the buffer
Write down the drift rate in RU per minute for each sensor at each step. These numbers show whether a change helped, and they give you a record to compare with the next surface.
On inQuiQ, buffer flows through all 4 channels in series, so you can run this test on every channel at once: leave one channel without ligand as the reference and compare its slope with the channels that carry ligand.
Fixes for surface drift
A new surface often drifts because it has not finished equilibrating. After immobilization, you may need to run buffer overnight before the surface is stable. A few warm-up cycles at the start of each run, with buffer injections and one regeneration step, serve the same purpose [1].
Capture surfaces are a separate case. A His-tagged ligand on a Ni-NTA surface is held with micromolar affinity, so it slowly leaches off and the baseline keeps falling. For small molecules, which give small signals, this drift can be larger than the binding signal [4]. Remedies include capturing less ligand, using multivalent tris-NTA, or crosslinking the captured ligand covalently. One tris-NTA example drifted about 2 RU per minute on average, low enough to correct even in a small molecule experiment. Crosslinking makes the ligand permanent, so you then need a regeneration that removes only the analyte [4].
If a covalent surface still drifts on the active sensor after a night of buffer flow, the ligand itself may be unstable in the running buffer. Test a fresh surface in a different buffer before you blame the chip.
How do you stop buffer-related drift?
Make every solution that touches the sensor as close to the running buffer as possible. Dilute samples in running buffer, or exchange them into it by dialysis or gel filtration [5]. After any buffer change, wash the pumps and tubing well before you start [1]. This removes most bulk shifts and the slow drift that follows them.
The measured signal is the sum of real binding and the bulk effect, which is the difference in refractive index between sample and running buffer [5]. Bulk shifts below about 10 RU are handled well by the reference surface, but larger ones are best avoided [1].
DMSO needs extra care in small molecule binding affinity work. If the compound needs DMSO, dialyze it against buffer that contains DMSO, then use the last dialysis buffer as running and dilution buffer [1].
Regeneration solutions with high salt or extreme pH can also leave drift behind, which is one reason to place blank cycles between samples [6].
Can you correct baseline drift in data analysis?
Steady baseline drift can largely be corrected in analysis with double referencing. Double referencing first subtracts the reference sensor from the active sensor, then subtracts buffer blank injections from the analyte injections [1]. This removes most differences between channels. It works poorly when drift changes during the run, for example when ligand loss also lowers binding capacity.
Where you place the blanks matters. Blanks work best close in time to the analyte injections and after the warm-up cycles, once the baseline has started to settle [6]. A blank every few cycles lets you follow drift through the whole run. If your software can fit a linear drift term, use it with care: the term can absorb a real, slow dissociation.
A simple final check: after referencing, the buffer-only baseline should show almost no slope, and the baseline, association and dissociation phases should connect smoothly [1].
Measuring tight binders on inQuiQ
Drift hurts most when you need long dissociation phases for tight binders, or when you run many cycles on one surface. On the inQuiQ benchtop biosensor, baseline drift is typically below 0.3 RU/min, baseline noise is below 0.1 RU RMS, and temperature is controlled from 16 to 40 °C. Once the buffer-only test above is passed, what is left on your trace is the surface and the binding.
The Measuring Tight Binders application note shows a tight binder measurement on inQuiQ [7]. Noise and drift are different things, so the buffer-only test still applies to every new surface. The sensors are regenerable and can be reused across runs, so the surface you have just checked can carry the follow-up measurements.
Questions researchers ask
How much baseline drift is acceptable?
There is no single limit. Compare the drift over your dissociation window with the signal change you expect from dissociation. If the drift is a small fraction of that change, double referencing will handle it. If the two are similar in size, the koff is not reliable, and you should stabilize the surface first.
Should I degas the running buffer?
Yes, in most flow-based systems. Dissolved air can form small bubbles when buffer warms up inside the instrument, and bubbles cause spikes and sudden jumps. Filter and degas fresh buffer, and let it reach instrument temperature before you start. Some instruments degas in line, so check the manual.
What makes a good reference surface?
One that matches the active surface as closely as possible without the ligand, for example a surface that is activated and blocked but not coupled. Some labs add an unrelated protein of similar size. The closer the match, the more bulk effect, drift and non-specific binding the reference removes.
Why does my baseline drop after each regeneration?
Either the regeneration removes some ligand, or the surface is still recovering from the harsh solution. If the drop is similar each cycle and binding capacity stays stable, it is equilibration, and a buffer wash after regeneration helps. If capacity falls from cycle to cycle, try milder regeneration conditions.
Can temperature changes in the lab cause drift?
Yes. The refractive index of buffer changes with temperature, so a sensor that reads refractive index also reads temperature. Let the instrument and buffers equilibrate after start-up, keep the instrument away from air vents and direct sun, and bring cold samples to room temperature before you inject them.
Is drift worse on a freshly prepared surface?
Often, yes. A surface that was just immobilized still releases loosely bound material and leftover reagents, so the first hours tend to show the most drift. Immobilize the day before if you can, leave buffer flowing, and start kinetics only when consecutive blank injections overlay.
References
- Marquart JA. SPRpages – Getting a Feeling for the Curves. Handbook of Surface Plasmon Resonance. 2017. doi:10.1039/9781788010283-00106
- Myszka DG. Improving biosensor analysis. J Mol Recognit. 1999. doi:10.1002/(SICI)1099-1352(199909/10)12:5<279::AID-JMR473>3.0.CO;2-3
- Luan E, Shoman H, Ratner DM et al.. Silicon Photonic Biosensors Using Label-Free Detection. Sensors (Basel). 2018. doi:10.3390/s18103519
- Gedig ET. Surface Chemistry in SPR Technology. Handbook of Surface Plasmon Resonance. 2017. doi:10.1039/9781788010283-00171
- Real-Time Analysis of Biomolecular Interactions. Springer Japan. 2000. doi:10.1007/978-4-431-66970-8
- Ditto NT, Eckman J. Treating Raw Data: Software for SPR Applications. Handbook of Surface Plasmon Resonance. 2017. doi:10.1039/9781788010283-00328
- Delta Life Science. Measuring Tight Binders. Application note. Link
Keep reading
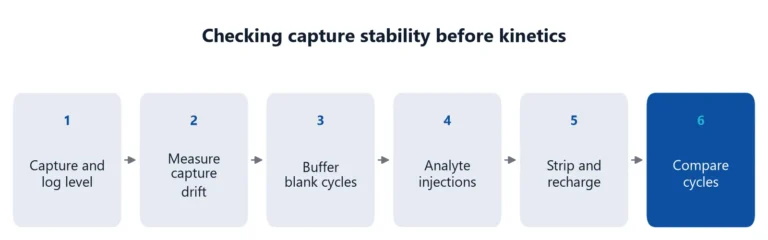 His tag capture assay: what to check when capture levels driftHis-tag capture is fast and reversible, but the ligand keeps leaving the surface. How to measure that drift, keep it apart from the analyte interaction, and reduce it.Assay setup
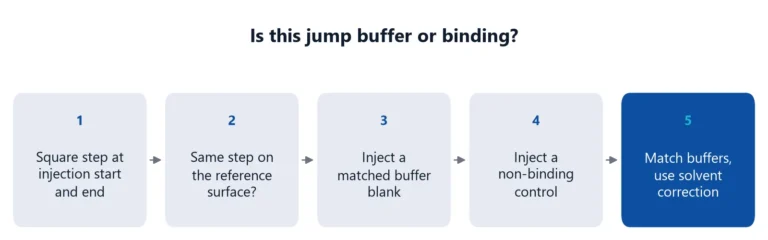 Bulk shift or binding? How to match buffers and read the jumpA square jump at the start of an injection is usually buffer, not binding. How to recognize a bulk shift, why the reference channel does not fully remove it, and how to match buffers.Applications
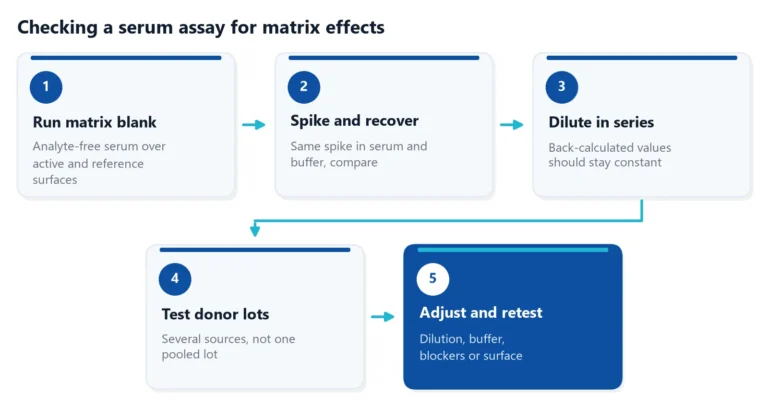 Matrix effects in binding assays: how serum changes your signalSerum can raise, lower or blur the signal of a binding assay. Learn where matrix effects come from, how to test for them, and how to reduce them in ELISA and label-free assays.