
On this page
Questions about your own assay?
Ask a specialistMost nanobodies bind their antigen with nanomolar to picomolar affinity. The most informative measurement is real-time kinetics: immobilize the antigen, flow the monovalent nanobody over it, and fit kon and koff to get KD. Check the nanobody is monomeric, plan long dissociation for slow off-rates, and confirm key values with a second method.
What nanobody binding affinity to expect
Nanobody binding affinity is usually in the nanomolar to picomolar range, despite the small size of the domain (about 12 to 15 kDa) [1]. A 2025 review describes VHH affinities as similar to those of classical antibodies [2]. Where your nanobody falls in that range also depends on how it was found.
- Immune libraries from immunized camelids benefit from in vivo affinity maturation and tend to give the strongest binders [2]
- Naive, synthetic and semi-synthetic libraries: synthetic and semi-synthetic libraries often give lower affinities than immune libraries, although one optimized semi-synthetic library produced binders between about 100 pM and 10 nM [2]
- De novo designed VHHs so far start weaker: in one 2025 study the best binders per target had KD values of 140 to 560 nM, and in another, designed binders with initial KD values such as 78 and 260 nM were improved to low nanomolar by affinity maturation [2]
Two well-studied examples show the spread. Two anti-lysozyme nanobodies used as reference binders have reported KD values of 5 and 19 nM [1]. An anti-GFP nanobody binds EGFP with a KD of a few picomolar, measured with a single-molecule fluorescence method that works at picomolar concentrations [3]. A picomolar binder needs a different assay design from a 100 nM binder.
Which method should you use to measure nanobody binding affinity?
Use a real-time, label-free biosensor when you need kinetics (kon and koff) as well as KD, or when you compare many clones. Use a solution method such as ITC when you need thermodynamics or stoichiometry without a surface. For the most important values, measure with two methods; in published comparisons for nanobodies, well-run methods agreed within about 2 to 3 fold.
Two studies illustrate that last point. For one sfGFP and nanobody pair, a set of solution methods (MST, FCS, analytical ultracentrifugation, ITC and SEC-MALS) consistently pointed to a single-digit nanomolar KD and 1:1 stoichiometry [4]. For single-domain antibodies binding soluble CD4, three surface biosensor methods gave KD values within a 2.4-fold range in standard buffers with blocking proteins [5].
| Method | What you get | Label | Main limit for nanobodies |
|---|---|---|---|
| Surface biosensors (surface plasmon resonance (SPR), BLI, photonic sensors) | kon, koff, KD in real time | No | Surface effects: orientation, avidity, mass transport |
| Isothermal titration calorimetry (ITC) | KD, enthalpy, stoichiometry | No | Higher protein use; very tight binding is hard to resolve |
| Solution fluorescence methods (MST, FCS, single-molecule) | KD in solution | Usually yes | Dye can affect binding; no rates from most setups |
| ELISA | Apparent binding strength (EC50) | Yes | Endpoint only; wash steps favor slow off-rates |
Surface plasmon resonance is the most widely used technique for nanobody kinetics [1]. Photonic biosensors such as inQuiQ use the same principle: binding changes the refractive index in an evanescent field at the sensor surface. ELISA still suits early selection, when a yes or no answer on hundreds of clones is enough. Move to kinetics once you must choose between binders, because two clones with the same ELISA signal can have very different off-rates.
Set up the assay: orientation, monomer check and avidity
A common format, used in the cited protocol, immobilizes the antigen and injects the nanobody as the analyte [1]. A single-domain nanobody is monovalent, so each binding event is 1:1 and the fit stays simple. A small nanobody gives a lower response than an IgG would, so check that the expected maximum response is well above the baseline noise.
Watch for avidity in engineered formats. A bivalent analyte that binds two surface sites stays bound when one site lets go, so its apparent affinity is higher than its true affinity [6]. In one study, a monovalent VHH bound EGFR with a KD of 55 nM, while the pentavalent and bivalent (Fc fusion) versions showed about 10-fold and 600-fold higher apparent affinity, respectively [7]. To measure intrinsic affinity of a VHH-Fc or tandem construct, reverse the format: capture the multivalent molecule and inject monomeric antigen [6].
Check that the nanobody is monomeric. In one protocol, the Strep-tagged version of nanobody H04 was about 83% multimeric after purification, and the dimer of its His-tagged version had earlier been reported not to bind lysozyme [1]. Run size exclusion before the binding assay and inject only the monomer fraction.
Choose the immobilization. Amine coupling is simple but orients the ligand randomly, which leaves part of it inactive: one nanobody study measured 20% to 76% surface activity [1,6]. Capture through a His tag, biotin and streptavidin, or an antibody gives a more uniform surface [6]. Keep the ligand density low.
Plan concentrations, dissociation time and regeneration
Inject a dilution series that spans the expected KD, from well below to well above it. For a nanobody with a KD near 5 nM, one protocol used two-fold dilutions from 0.6 to 300 nM [1]. Prepare every sample in the running buffer itself, from the same batch [1].
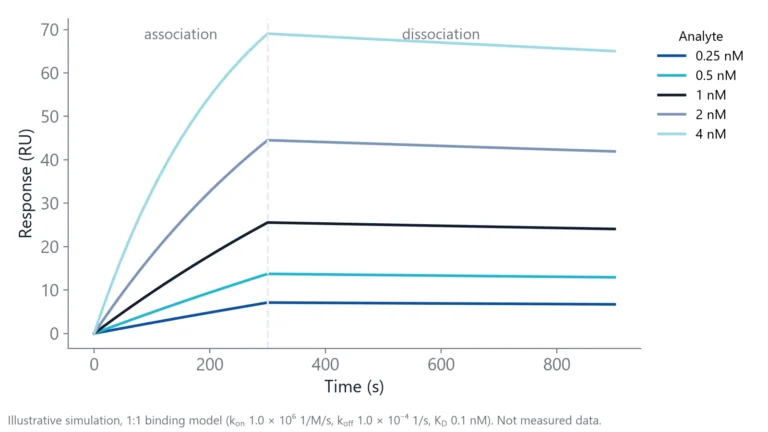
Dissociation time needs special care. Tight nanobodies often have a very slow koff, and a short dissociation phase shows almost no decay, so the fit cannot estimate koff with confidence.
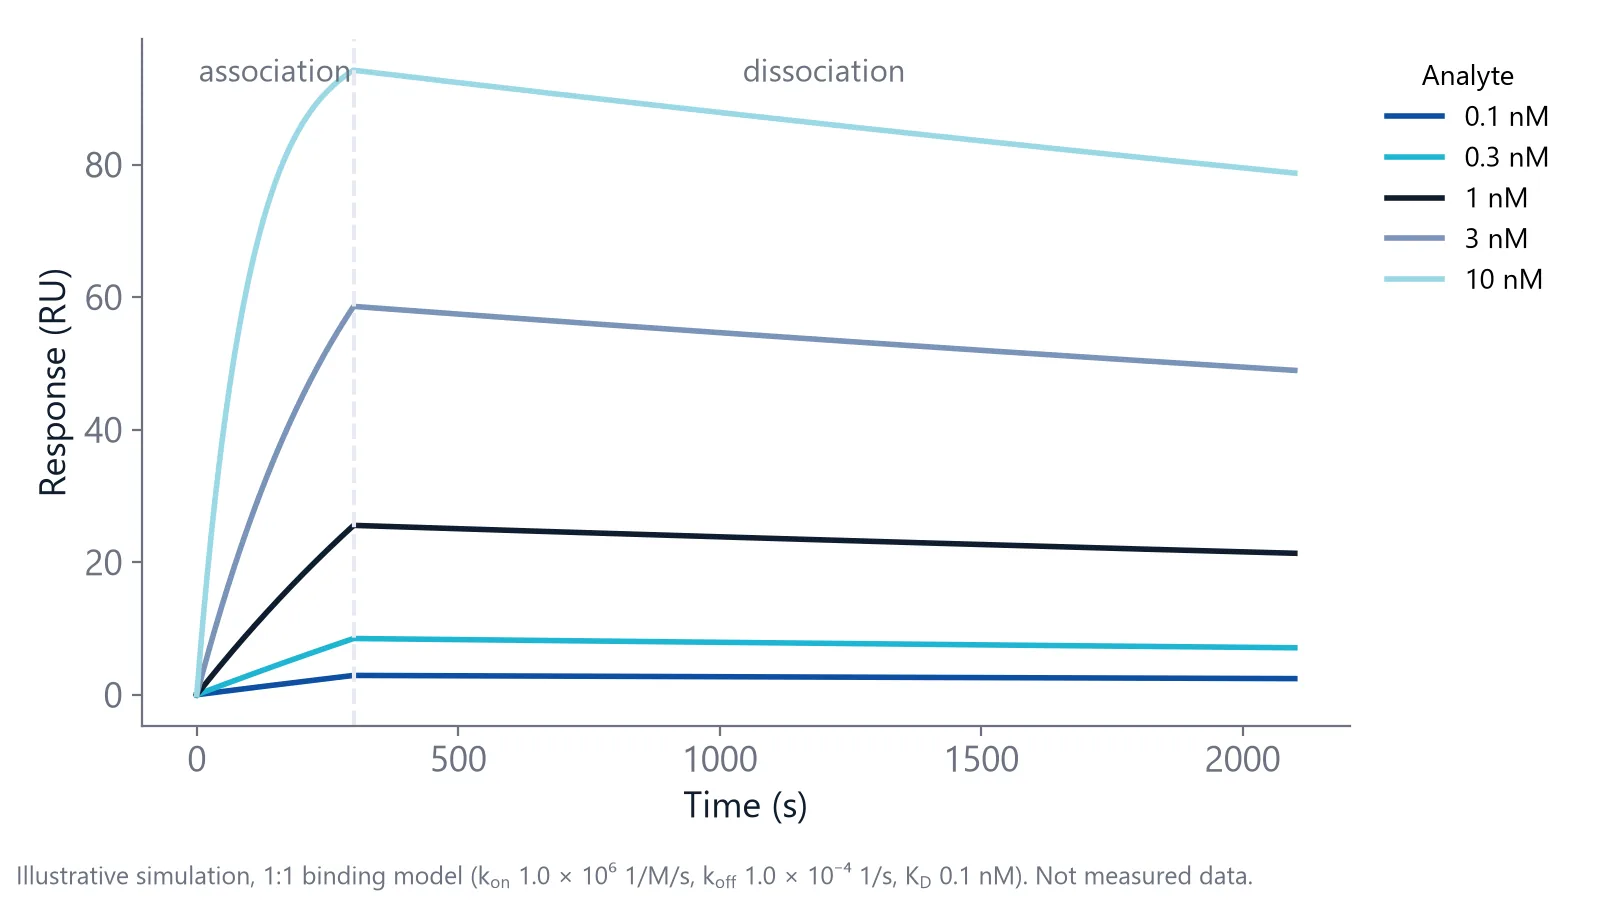
A worked number makes the point. With koff = 1 × 10⁻⁴ 1/s, the complex half-life is ln 2 divided by koff, about 1.9 hours. A 10-minute dissociation phase captures only about 6% decay. Extend the dissociation phase for your slowest binders, and accept that equilibrium (steady-state) fits are impractical for them because they take hours to reach equilibrium.
Regeneration
Between cycles, the bound nanobody must be removed without damaging the antigen. One nanobody protocol used a short pulse of 100 mM glycine at pH 2.2, followed by a short pulse of 10 mM NaOH [1]. Scout conditions from mild to harsh, and check that the response stays stable over repeated cycles. If none works, single-cycle kinetics (all concentrations injected in sequence, one dissociation at the end) avoids regeneration.
How do you know your nanobody KD is reliable?
A nanobody KD is reliable when the 1:1 fit describes all concentrations with small, random residuals, the rate constants do not change with ligand density, references and blanks have been subtracted, and replicates agree. For key clones, a second method should give a similar value (in published nanobody comparisons, within about 2 to 3 fold).
Checks to run
- Double referencing: subtract a reference channel and a buffer blank to remove drift, bulk shifts and nonspecific signal [1]
- Mass transport: change the ligand density and check that kon stays the same. Flow rate is a weaker test, because transport scales with only the cube root of flow [8]
- Rebinding: a koff that slows at high ligand density points to rebinding, not tighter binding [8]
- Same surface for ranking: compare clones on one ligand surface, so differences reflect affinity and not surface quality [1]
- Orthogonal check: confirm lead values in solution, for example by ITC [4]
When you report the result, give kon, koff and KD with the spread across replicates, plus the temperature, buffer, assay format and which partner was immobilized.
For a broader view of kinetics across antibody formats, see our page on antibody affinity and kinetics for engineered antibodies.
Nanobody kinetics on inQuiQ
Nanobodies often bind in the nanomolar to picomolar range, so the measurement has to resolve fast association and very slow dissociation. The inQuiQ benchtop biosensor covers a KD range of 10 pM to 10 mM and dissociation rate constants down to 10⁻⁶ s⁻¹, with baseline drift typically below 0.3 RU/min during long dissociation phases. For very slow off-rates, the tight binders application note shows a long dissociation protocol [9].
Clone panels fit the channel layout: the antigen, an ortholog and a mutant each get a channel, and the fourth channel is the reference. Each nanobody you inject flows through all four channels in series, so one injection gives KD, kon and koff against all three targets.
Questions researchers ask
Do nanobodies bind as tightly as conventional antibodies?
Often yes, per binding site. Many nanobodies reach the same nanomolar to picomolar affinities as antibodies. A full IgG can look stronger in some assays because its two arms bind at once (avidity). Compare intrinsic affinities with monovalent formats, such as a Fab against a single nanobody, to make a fair comparison.
Should I report a kinetic or a steady-state KD for a nanobody?
For tight binders, report the kinetic KD from koff and kon, because reaching equilibrium can take hours. Steady-state fits work for weaker nanobodies with fast rates. When both are possible, report both: agreement is a good sign that the 1:1 model fits.
Does the purification tag change nanobody binding?
It can. A tag rarely changes the binding site itself, but it can change how the protein folds, multimerizes or attaches to a surface. Test each tagged construct separately, confirm it is monomeric by size exclusion, and do not compare affinities of differently tagged versions as if they were one molecule.
How can I screen many nanobody clones before full kinetics?
Start with an off-rate ranking. Capture each clone or inject it at one concentration and record dissociation. The dissociation rate constant koff does not depend on concentration, so clones can be ranked even when their exact concentration is uncertain, as in crude extracts. Then run full concentration series only on the best clones.
Can I measure nanobody affinity in serum or plasma?
Yes, but nonspecific binding from serum proteins can disturb the baseline and the reference signal. Use a surface that resists fouling, a well-matched reference, and dilute the matrix as far as the assay allows. Compare the KD with a value measured in clean buffer to see how much the matrix changes the result.
References
- Díaz-Galicia E, Gutu N, Peng Y et al.. Surface Plasmon Resonance (SPR) Workflow for Comparative Analysis of Nanobody Variants Binding to Lysozyme as a Model Ligand. Curr Protoc. 2026. doi:10.1002/cpz1.70360
- Evers A, Guarnera E, Pekar L et al.. From discovery to the clinic: structural insights, engineering options, clinical, and 'next wave' applications of camelid-derived single-domain antibodies. MAbs. 2025. doi:10.1080/19420862.2025.2583210
- Schedler B, Yukhnovets O, Lindner L et al.. The Thermodynamic Fingerprints of Ultra-Tight Nanobody-Antigen Binding Probed via Two-Color Single-Molecule Coincidence Detection. Int J Mol Sci. 2023. doi:10.3390/ijms242216379
- Demeler AK, Bosco J, Sydor MJ et al.. Integrative biophysical characterization of molecular interactions: A case study with the sfGFP-nanobody complex. Anal Biochem. 2025. doi:10.1016/j.ab.2025.115859
- Dirscherl L, Merz LS, Kobras R et al.. Focal Molography Allows for Affinity and Concentration Measurements of Proteins in Complex Matrices with High Accuracy. Biosensors (Basel). 2025. doi:10.3390/bios15020066
- Real-Time Analysis of Biomolecular Interactions. Springer Japan. 2000. doi:10.1007/978-4-431-66970-8
- Iqbal U, Trojahn U, Albaghdadi H et al.. Kinetic analysis of novel mono- and multivalent VHH-fragments and their application for molecular imaging of brain tumours. Br J Pharmacol. 2010. doi:10.1111/j.1476-5381.2010.00742.x
- Handbook of Surface Plasmon Resonance. The Royal Society of Chemistry. 2017. doi:10.1039/9781788010283
- Delta Life Science. Measuring Tight Binders. Application note. Link
Keep reading
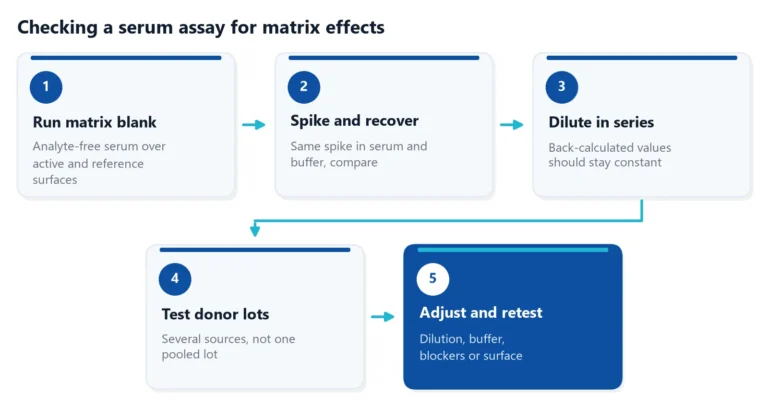 Matrix effects in binding assays: how serum changes your signalSerum can raise, lower or blur the signal of a binding assay. Learn where matrix effects come from, how to test for them, and how to reduce them in ELISA and label-free assays.Applications
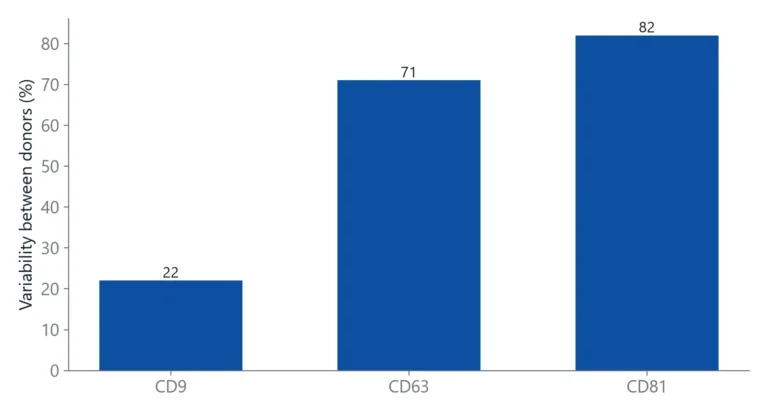 Tetraspanins CD9, CD63 and CD81: EV markers and binding targetsTetraspanins CD9, CD63 and CD81 are the standard handles for detecting and capturing extracellular vesicles. This article explains what they are, why they are not on every vesicle, and how to set up binding measurements around them.Assay setup
 Baseline drift in a biosensor: why it happens and how to stop itBaseline drift is often blamed on the chip. A short buffer-only test shows whether the surface, the buffer or the instrument is the real cause.