
On this page
Questions about your own assay?
Ask a specialistA ring resonator biosensor is a tiny loop on a chip that traps light. Only certain wavelengths of light fit in the loop. When molecules bind to its surface, the wavelength that fits shifts, and tracking that shift over time gives you a real-time binding curve. Temperature and buffer move the wavelength too, so control both.
What is a ring resonator biosensor?
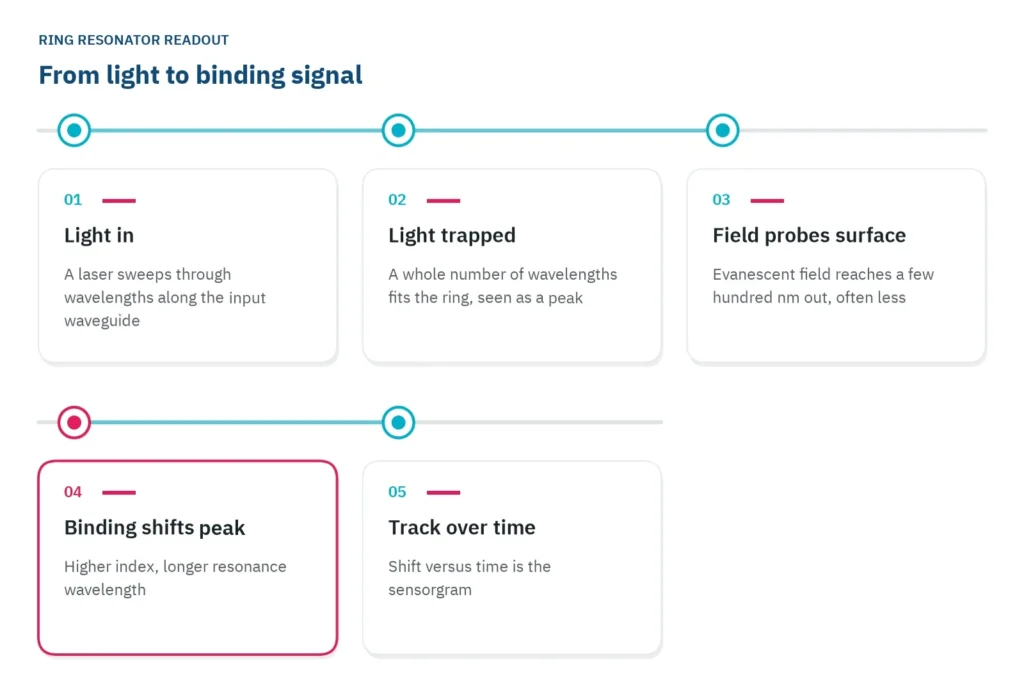
A ring resonator biosensor is a chip-based optical sensor that detects binding without labels. A small loop of waveguide, a channel that guides light the way an optical fiber does, sits between two straight ones. Light of certain wavelengths circulates in the loop, and molecules that bind to its surface change which wavelengths those are [1].
Think of a guitar string, which rings at certain pitches only. The loop does the same with light. It is a few tens to a few hundred micrometers across [2], and a wavelength is trapped in it when a whole number of wavelengths fits around the loop [2]. At those wavelengths the light builds up in the ring. A second straight waveguide on the far side, the drop port, picks up that light, so the spectrum read there shows a row of sharp peaks.
How sharp a peak is has a name: the quality factor, or Q. It is the peak position divided by its width at half height [1]. A high Q means a narrow peak, which is easier to locate, so smaller shifts stand out from the noise. The silicon rings in one design study reached Q values of 100,000 to 150,000 [2].
Binding shifts the resonance to a longer wavelength
The light does not stay entirely inside the waveguide. A thin tail of it, the evanescent field, reaches into the liquid above the chip and fades within a fraction of a wavelength, a few hundred nanometers at most [3]. Only what sits inside that thin layer affects the light.
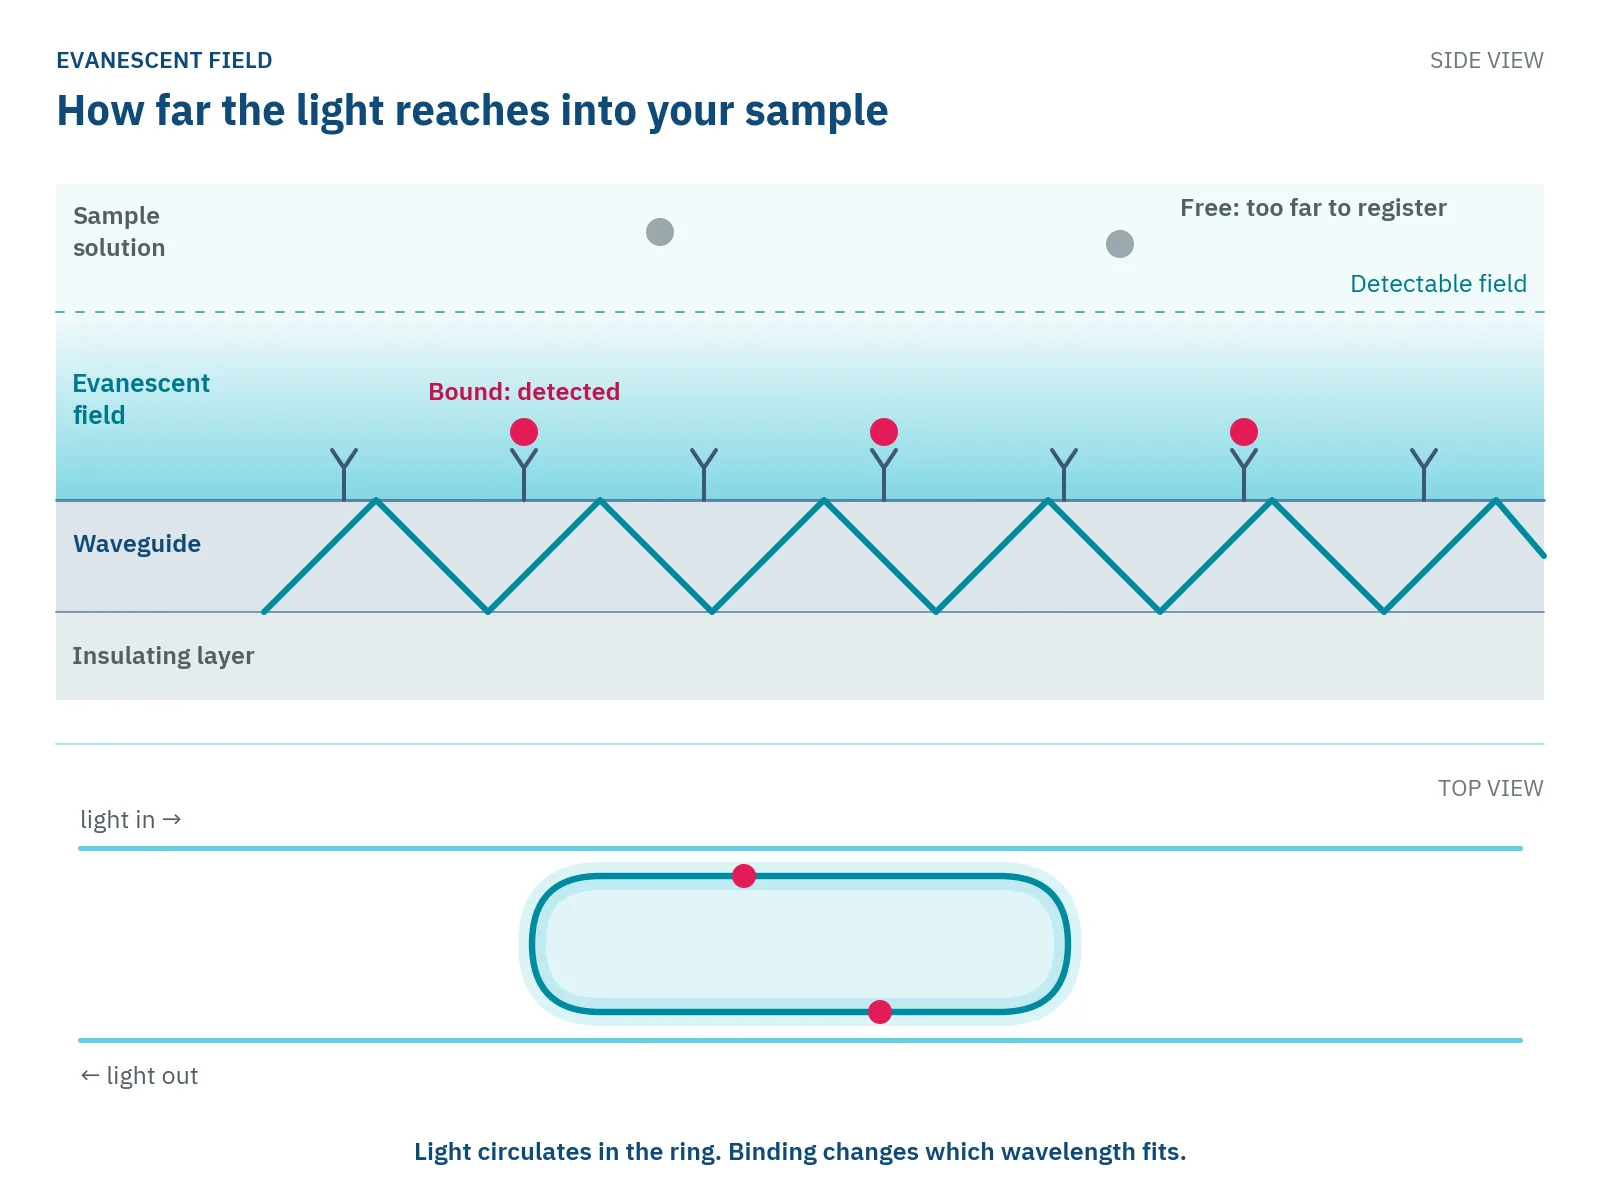
If you use surface plasmon resonance (SPR), this will sound familiar. SPR and Nanophotonic Evanescent field Sensing (NES) rest on the same principle: binding changes the refractive index, a measure of how strongly a material slows light, inside an evanescent field. NES, Delta's technology, reads that change with optical ring resonators on a photonic integrated circuit, a chip that guides light instead of current. You can see how photonic biosensing works on the NES chip.
Immobilize a ligand on the ring, for example an antibody, and flow the analyte over it. Bound protein has a higher refractive index than the buffer it replaces, so the effective index rises and the ring traps a longer wavelength [2]. More bound mass gives a larger shift, so the size of the shift tells you how much has bound [1].
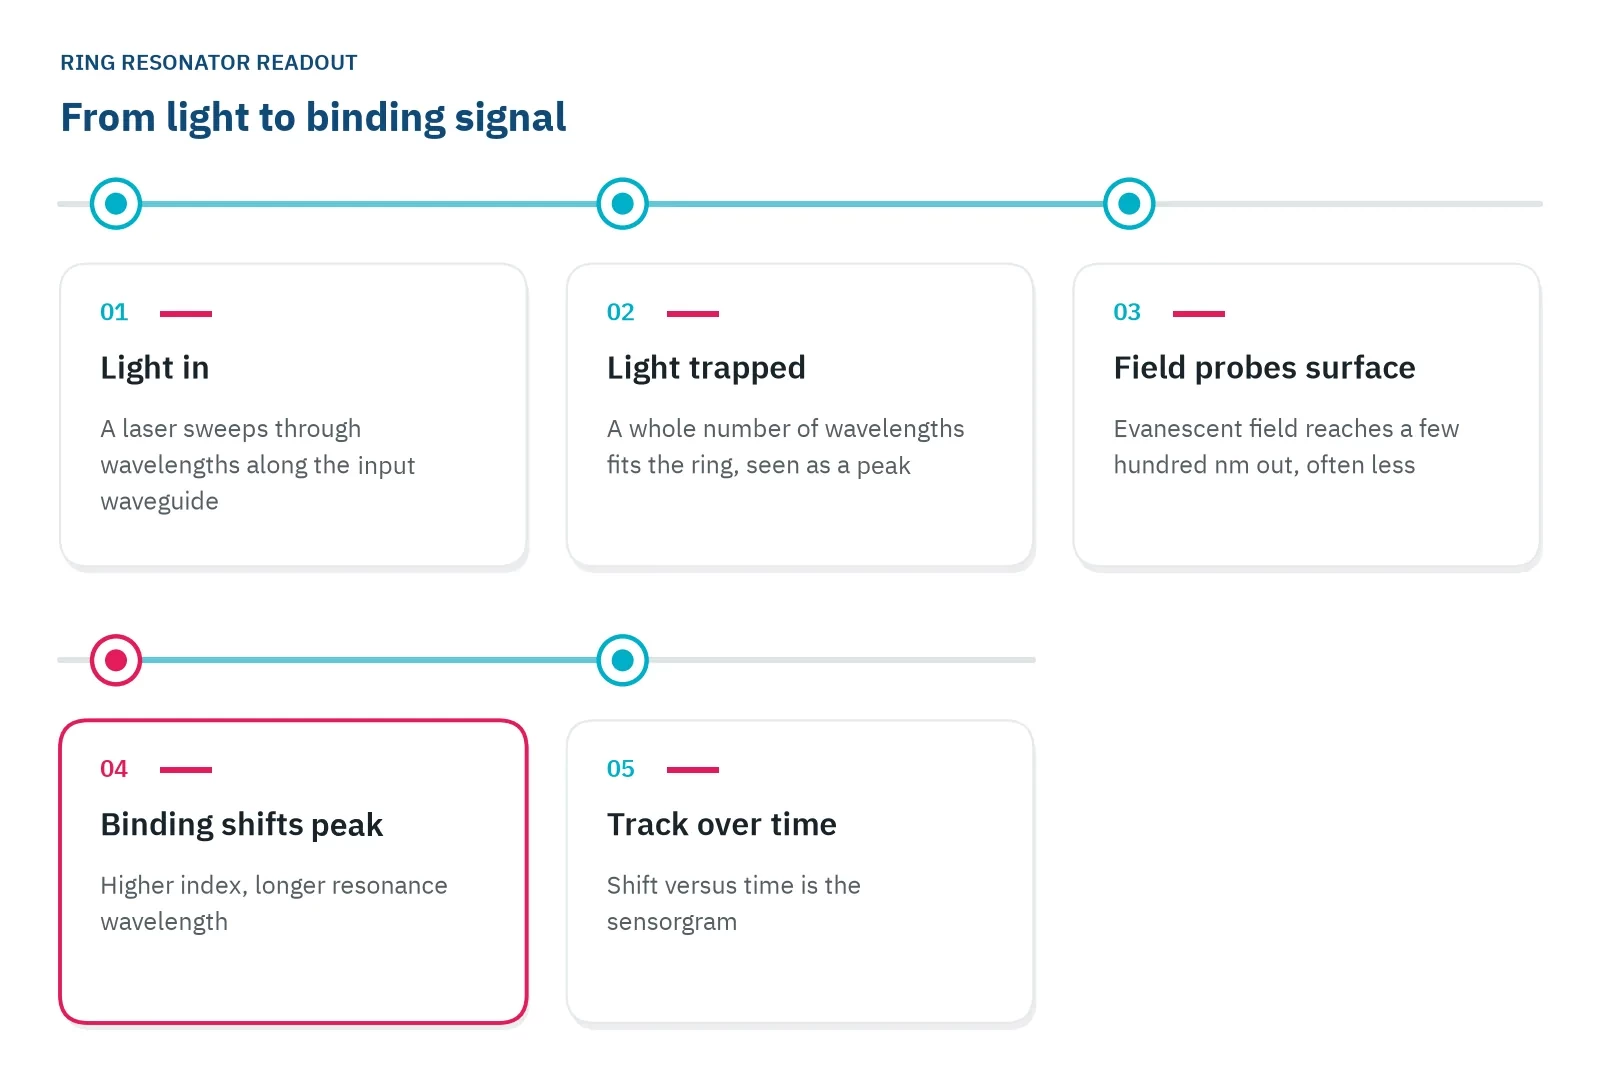
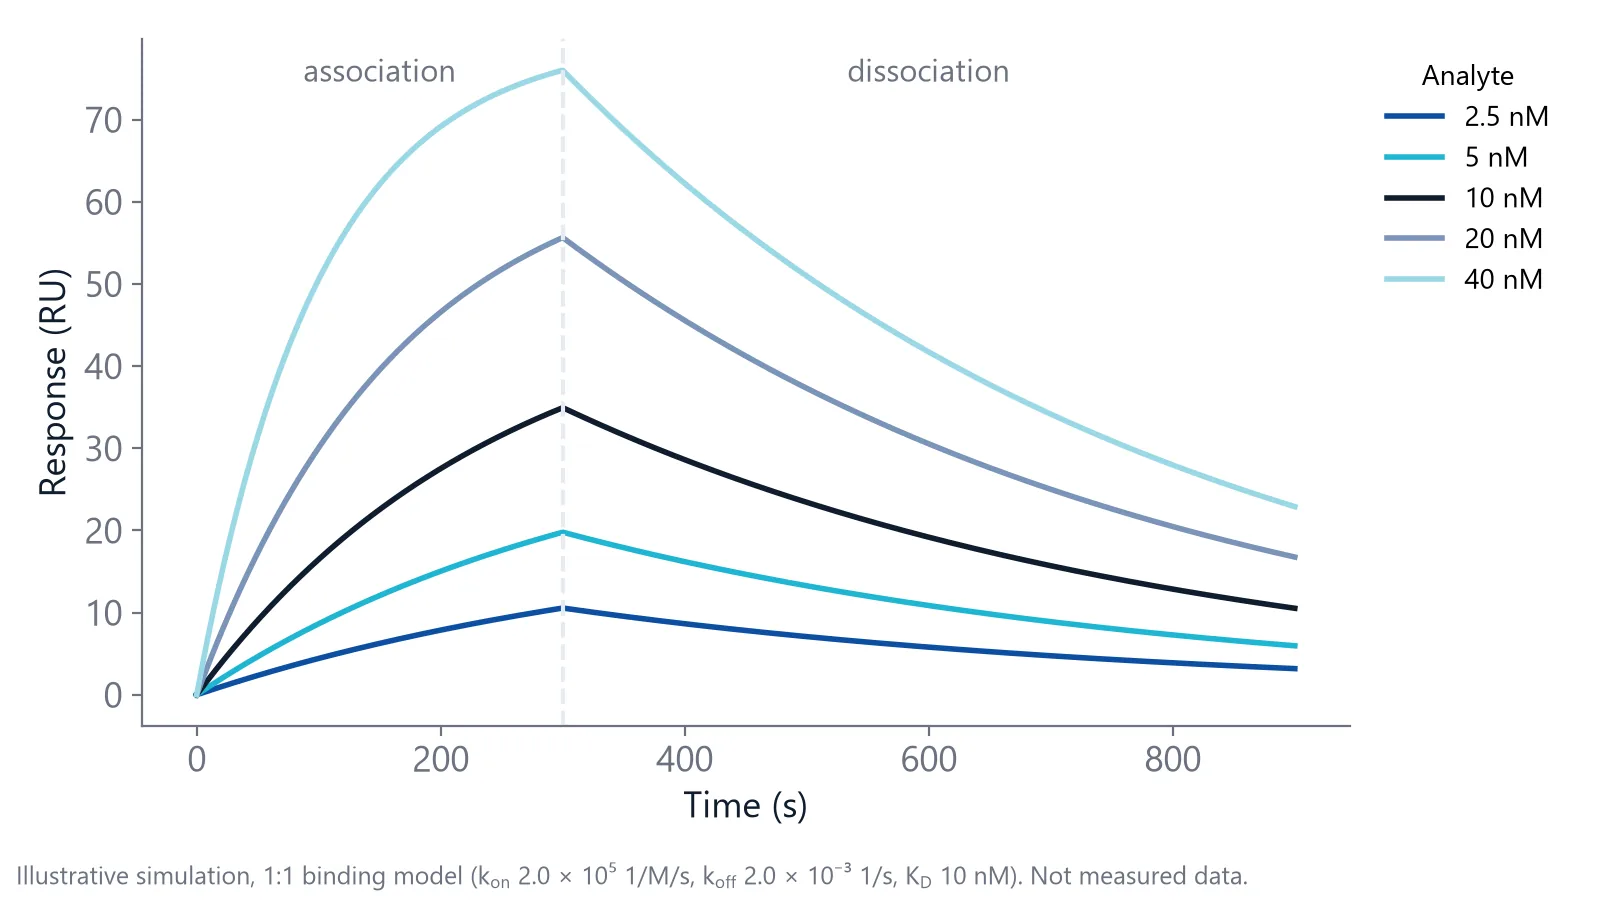
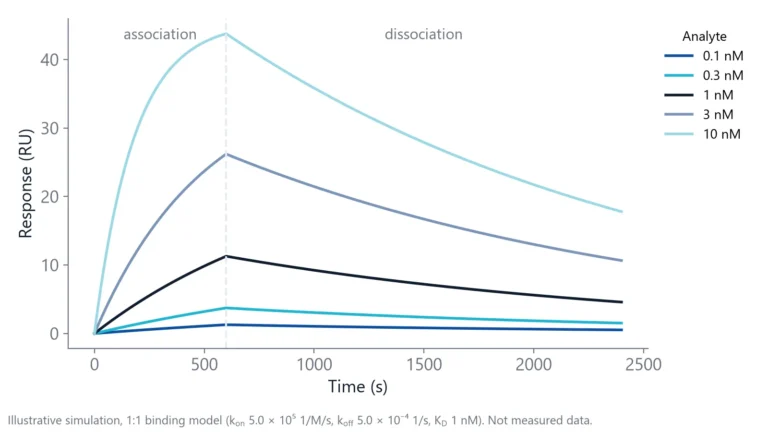
Track the peak position continuously and plot the shift against time. That plot is a sensorgram. The rise during injection is association, the fall in running buffer is dissociation, and fitting both gives the rate constants kon and koff, how fast complexes form and how fast they fall apart [1].
What happens on the ring during one binding cycle?
A cycle has five stages, and the peak moves at three of them. The ligand is captured on the ring, a blocking solution caps free sites, buffer sets the baseline, and injected analyte pushes the peak to longer wavelengths as molecules bind [2]. A buffer wash lets it drift back as complexes fall apart. A regeneration solution then strips the surface for the next cycle.
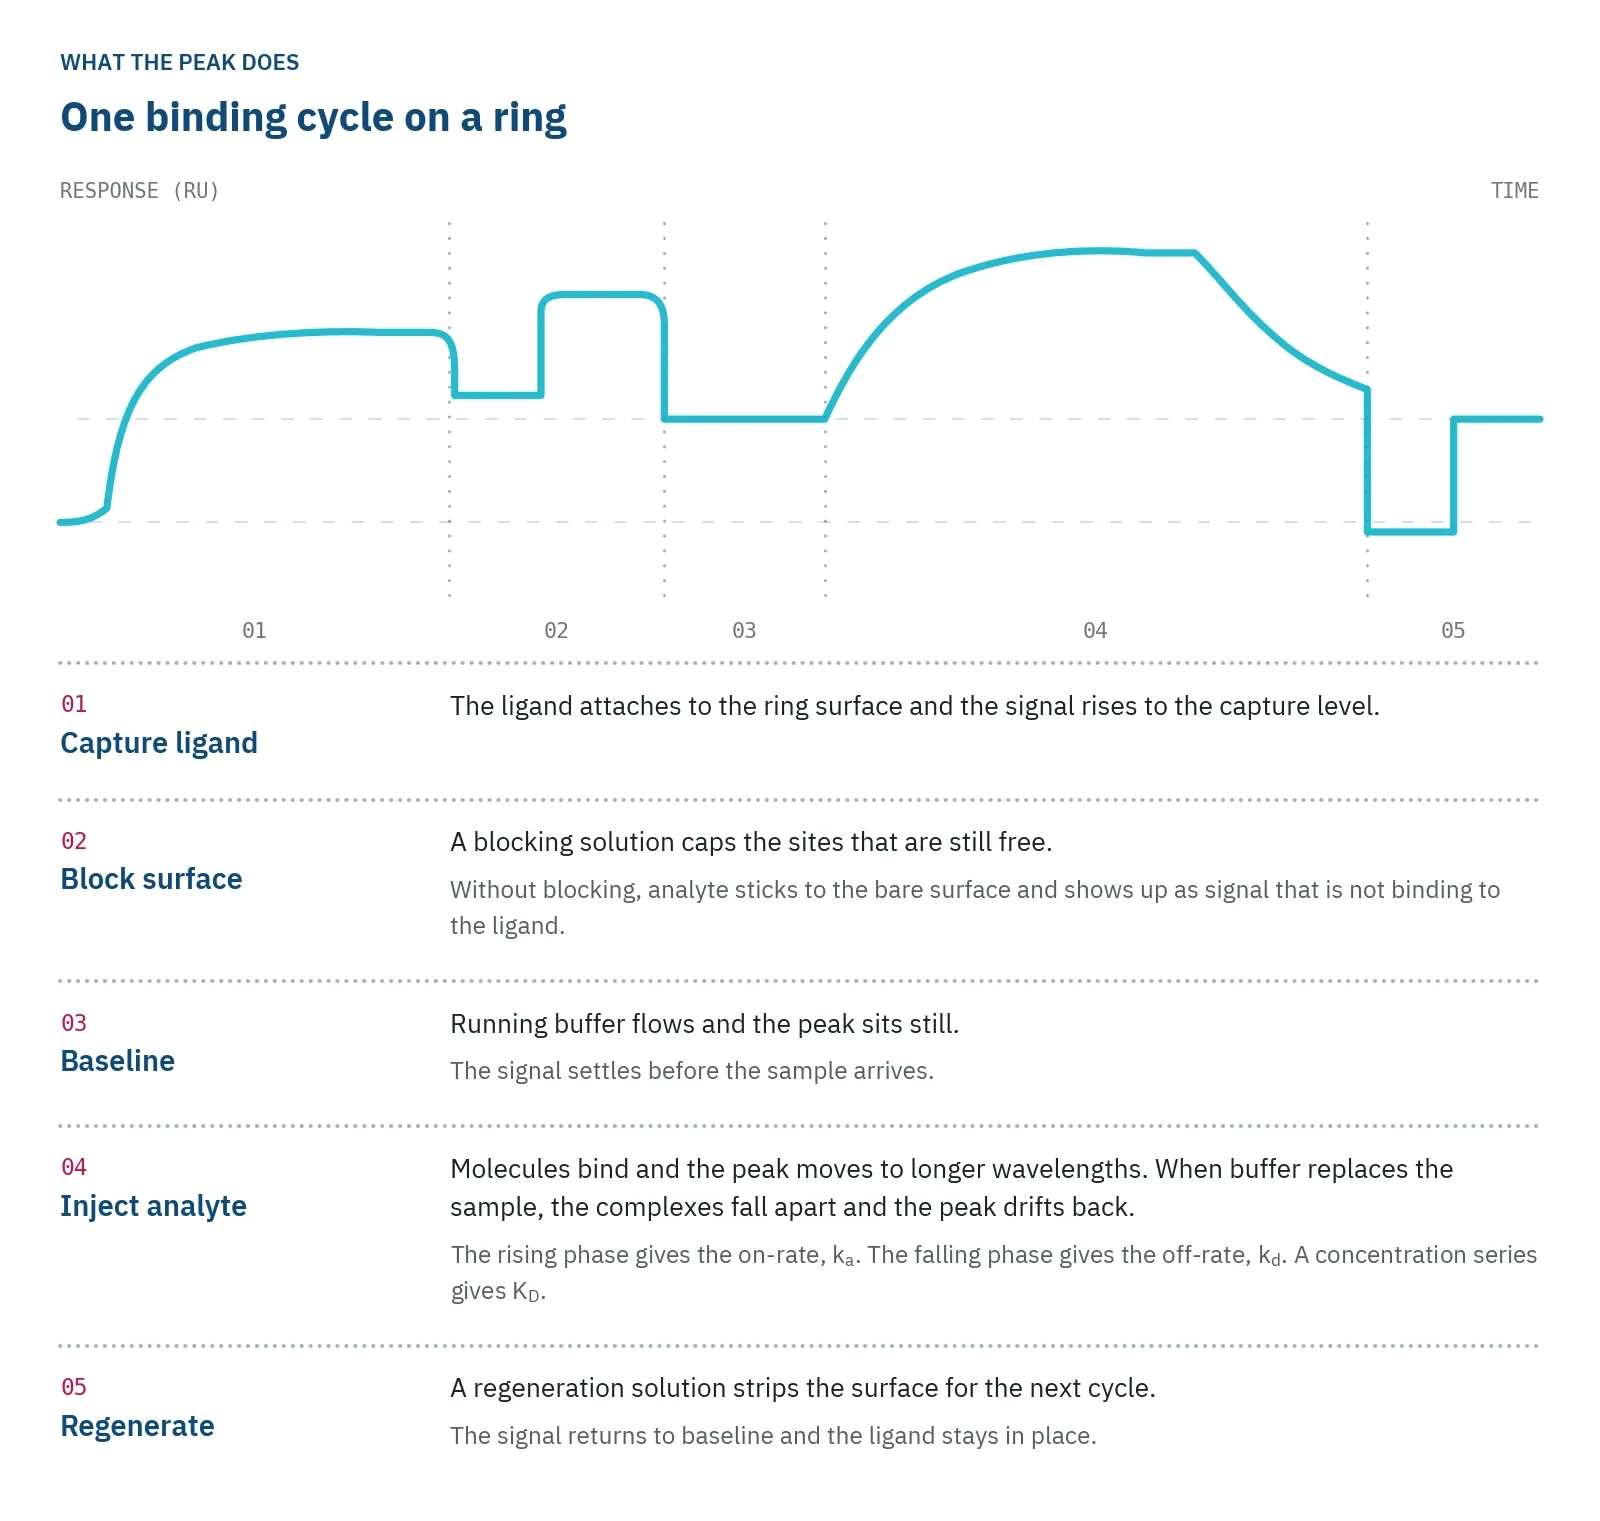
The signal is the position of the peak, so the instrument has to find it again and again. NES and SPR report the result in the same unit, resonance units (RU), where 1 RU is taken as 10-6 refractive index units (RIU) [5]. Published work on commercial ring resonator systems, inQuiQ among them, attributes their low noise to arrays of high-Q rings, active temperature stabilization, signal averaging and precise tracking of the peak [5].
Where the ligand sits matters too. The field is strongest at the waveguide and weaker farther out, so a thick capture layer holds the ligand where the field is weak. In one photonic bandgap sensor, half antibodies cut the recognition layer to about 2.5 nm [4]. Keep capture layers thin when you can.
Temperature and buffer move the resonance too
The resonance of a ring resonator biosensor responds to temperature, pressure and refractive index alike [1]. The ring cannot tell whether the index changed because protein bound or because the chip warmed up. Silicon nitride rings, made from a different waveguide material, are more thermally stable than silicon rings [1], and thermal management is still a design challenge for integrated photonic sensors [4].
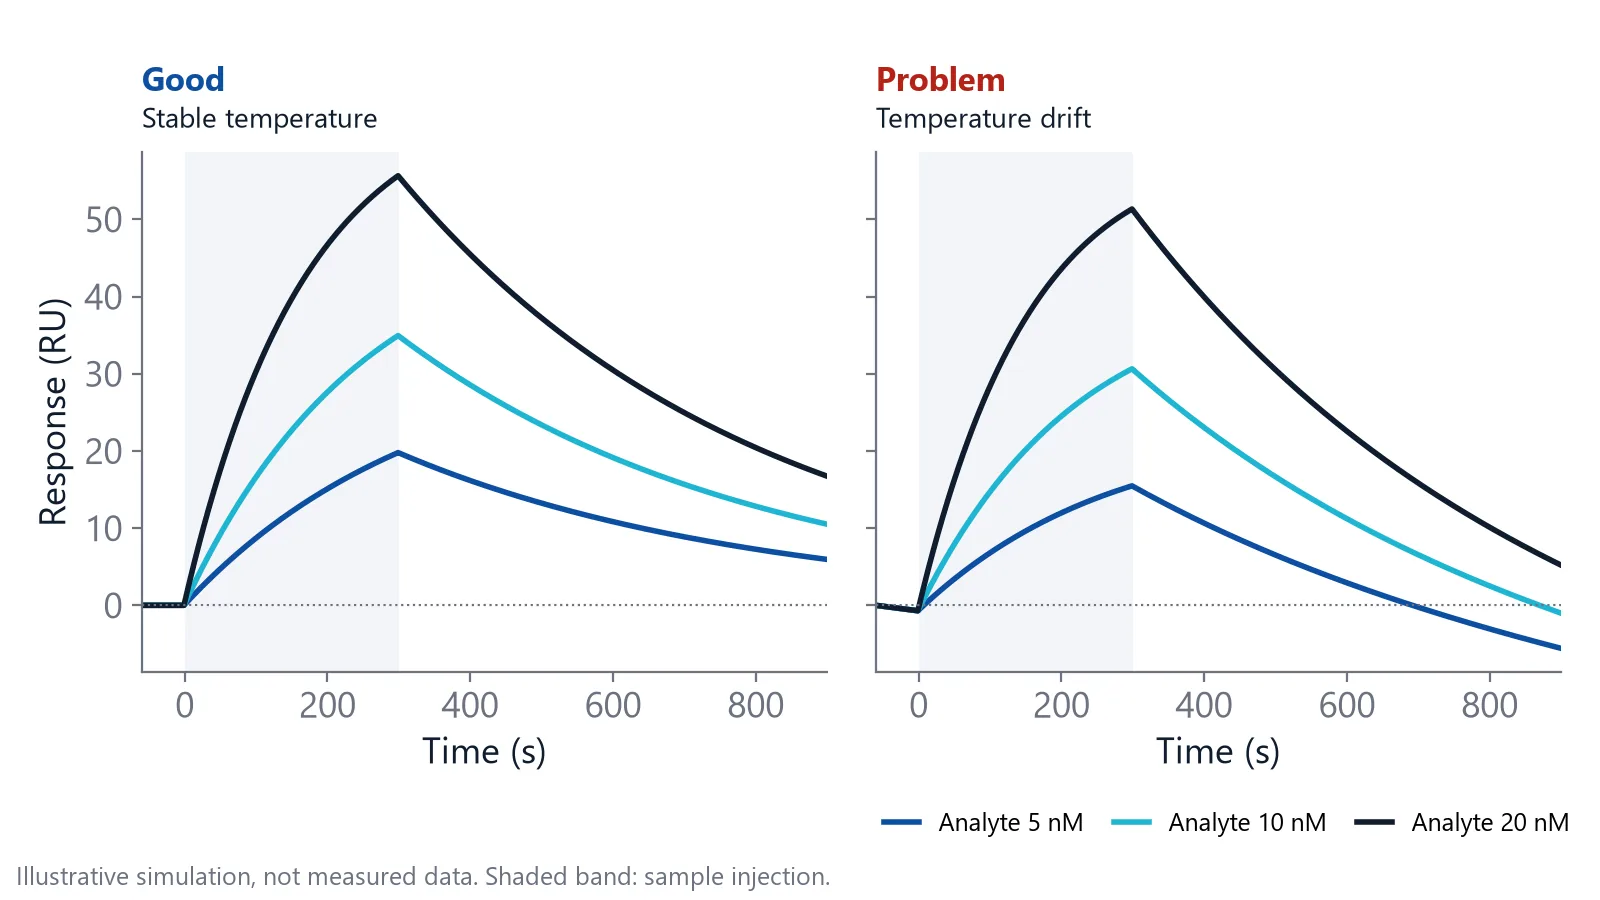
A change in the liquid itself also moves the peak. When the sample buffer differs from the running buffer, the whole sensing layer changes index at once [6]. On the sensorgram this is a square step at the start and end of the injection, often called the bulk shift, and it is not binding.
- Match the sample buffer to the running buffer, including any DMSO or glycerol
- Let the temperature settle before the first injection
- Subtract a reference surface without ligand that sees the same injection
A reference has its own catch: the ligand takes up part of the sensing layer on the active surface, so an uncalibrated bare reference can show a slightly larger bulk step [6]. Keep bulk differences small instead of relying on subtraction.
Arrays of rings measure many interactions at once
Rings are small and built with standard semiconductor processes, so many fit on one chip [2,4]. Give each ring its own capture molecule and one sample reports on several interactions at once. On inQuiQ, a chip spotted with a microarray spotter can carry up to 16 different capture molecules. Published arrays show what that gives you:
- Five protein biomarkers, among them prostate-specific antigen and interleukin-8, quantified together with no loss of sensitivity or precision [7]
- kon and koff for a DNA aptamer and a monoclonal antibody against thrombin, measured side by side [8]
- DNA detected in 10 minutes, and single-nucleotide variants told apart by how fast each duplex dissociated [9]
- Carcinoembryonic antigen quantified in buffer and undiluted fetal bovine serum, down to 2 ng/mL, comparable to a commercial ELISA kit [10]
Parallel rings rank binders under the same flow and temperature. For antibody campaigns, read more about antibody affinity and kinetics.
Know what a ring resonator cannot tell you
A ring resonator biosensor reports mass at the surface, not identity. Anything that sticks to the ring, specific or not, shifts the peak. Run a reference surface and a non-binding control protein to show that your signal is specific.
Mass transport limits small sensors: analyte must diffuse to the surface before it can bind [2]. Microrings typically detect proteins in the picomolar range within 10 to 30 minutes [2]. If your association phase changes when you change the flow rate, transport, not binding, sets the curve.
Serum, plasma and other biological matrices add non-specific binding on top of your signal. inQuiQ's antifouling hydrogel surface limits it, which supports measurements in serum and plasma.
A ring resonator gives you affinity, kinetics and concentration, not heat. A series of runs at different temperatures gives a van 't Hoff estimate of the enthalpy, from how KD changes with temperature, while isothermal titration calorimetry (ITC) measures heat in one experiment.
Questions researchers ask
Is a ring resonator the same as a whispering gallery mode sensor?
A ring resonator is one kind of whispering gallery mode resonator. The family also includes disks, spheres, toroids and capillaries, where light circulates along a curved edge. Rings and disks are flat and made on a chip, so they integrate easily with microfluidics.
Does the analyte need a label for a ring resonator measurement?
Neither analyte nor ligand needs a fluorescent or enzyme label, because the ring senses the index change that binding causes. The ligand does need to be attached to the ring surface, directly or through a capture molecule such as streptavidin or an anti-tag antibody.
Can a ring resonator detect small molecules?
Yes, but the signal is small. Because the signal follows bound mass, a small compound binding to a protein gives a far smaller response than an antibody. Use a higher ligand density, careful buffer matching and good referencing, and repeat injections to separate signal from noise.
Can a ring resonator sensor chip be reused?
Often, yes. A regeneration solution, such as a low pH buffer, strips bound analyte while leaving the ligand active, so the same surface can run many cycles. How many depends on how well the ligand tolerates regeneration. Check that the binding response stays the same over repeated cycles.
References
- Rho D, Breaux C, Kim S. Label-Free Optical Resonator-Based Biosensors. Sensors (Basel). 2020. doi:10.3390/s20205901
- Henriksson A, Kasper L, Jäger M et al.. An Approach to Ring Resonator Biosensing Assisted by Dielectrophoresis: Design, Simulation and Fabrication. Micromachines (Basel). 2020. doi:10.3390/mi11110954
- Schasfoort RBM. History and Physics of Surface Plasmon Resonance. Handbook of Surface Plasmon Resonance. 2017. doi:10.1039/9781788010283-00027
- Butt MA, Imran Akca B, Mateos X. Integrated Photonic Biosensors: Enabling Next-Generation Lab-on-a-Chip Platforms. Nanomaterials (Basel). 2025. doi:10.3390/nano15100731
- Morozov YM, Lapchuk AS. Quantum emitters in silicon: Purcell-enhanced lifetime modulation as a probe of local refractive index changes. Physical Review Applied. 2025. doi:10.1103/xj8f-nvt3
- Questions and Answers. Handbook of Surface Plasmon Resonance. 2017. doi:10.1039/9781788010283-00479
- Washburn AL, Luchansky MS, Bowman AL et al.. Quantitative, label-free detection of five protein biomarkers using multiplexed arrays of silicon photonic microring resonators. Anal Chem. 2010. doi:10.1021/ac902451b
- Byeon JY, Bailey RC. Multiplexed evaluation of capture agent binding kinetics using arrays of silicon photonic microring resonators. Analyst. 2011. doi:10.1039/c0an00853b
- Qavi AJ, Mysz TM, Bailey RC. Isothermal discrimination of single-nucleotide polymorphisms via real-time kinetic desorption and label-free detection of DNA using silicon photonic microring resonator arrays. Anal Chem. 2011. doi:10.1021/ac201659p
- Washburn AL, Gunn LC, Bailey RC. Label-free quantitation of a cancer biomarker in complex media using silicon photonic microring resonators. Anal Chem. 2009. doi:10.1021/ac902006p
Keep reading
 Biolayer interferometry vs SPR: which method fits your assayBoth methods measure binding label-free and in real time. The sample path, flow over a chip or a tip in a well, decides which one suits your hardest measurement.Applications
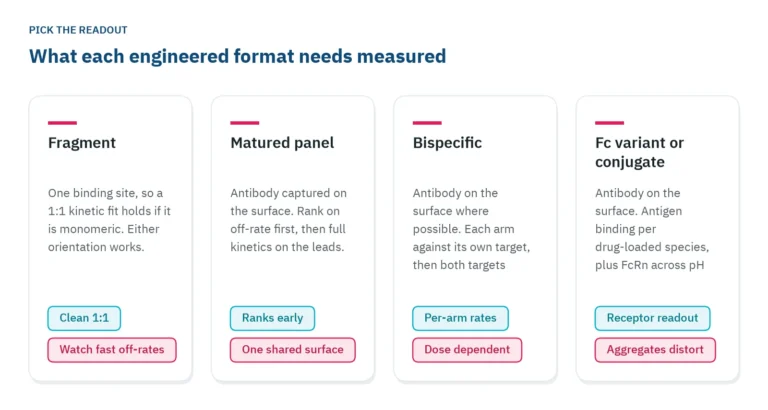 Antibody engineering: what binding data each format needsFragments, bispecifics, Fc variants and conjugates each need a different binding readout. Which parameter to measure, in which assay orientation, and why valency decides both.Applications
 How to measure antibody binding kinetics: setup, rates and reportingA practical guide to antibody binding kinetics: which partner goes on the surface, how to set concentrations and times from the expected rates, how to check the fit and what to report.