
On this page
Questions about your own assay?
Ask a specialistA bulk shift is signal from a refractive index difference between sample and running buffer, not from binding. It looks like a sharp step at the start and end of an injection. Reference subtraction removes only part of it, so match buffers exactly, run matched blanks, and use solvent correction when DMSO is present.
What the bulk effect in SPR is
The bulk effect in surface plasmon resonance (SPR) is the part of the signal caused by the solution itself, not by molecules binding to the surface. The SPR response is the sum of two things: analyte binding to the ligand, and the difference in refractive index between your sample and the running buffer [1]. The second part is the bulk effect, also called bulk shift or bulk response.
Anything dissolved in the sample adds to it: salt, buffer components and the analyte protein itself [1], but also solvents and additives such as DMSO [4] and glycerol [7]. In microring resonators and other evanescent field sensors, the field also senses the refractive index of the local environment [2], so the same rules apply to photonic biosensing.
Protein analytes can cause a bulk effect on their own. One study notes that the bulk response typically becomes significant at injected protein concentrations of about 100 µg/mL or higher [3]. This matters most for weak interactions, where you must inject high concentrations to see binding at all [3].
A step that is not removed sits on top of the start of association and dissociation, which carry most of the information about kon and koff, so it can distort the fitted rates.
How do you tell a bulk shift from real binding?
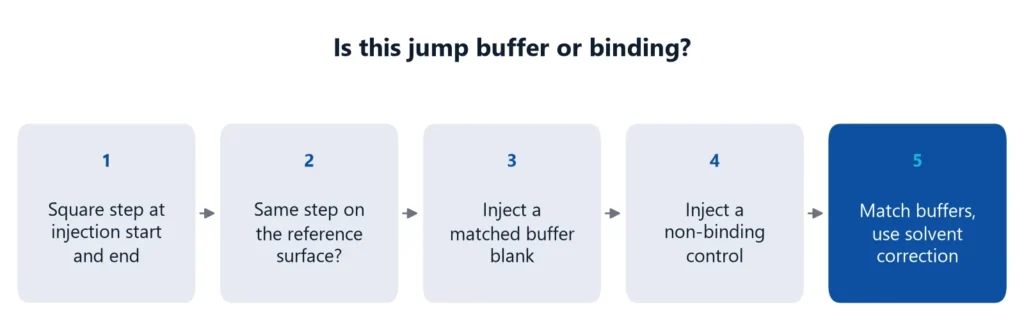
Look at the shape and at the reference. A bulk shift is a near-vertical step at the start of the injection, a flat plateau, and a step back to baseline when the injection ends. It appears on the reference surface too. Binding gives a curved association phase and a gradual dissociation, mainly on the active surface.
The table summarizes what to check.
| Feature | Bulk shift | Binding |
|---|---|---|
| Start of injection | Instant step | Curved rise |
| During injection | Flat | Approaches steady state |
| End of injection | Instant return to baseline | Gradual decay |
| Reference surface | Similar step | Little or no signal |
| Buffer blank | Shows the same step if buffers differ | No signal |
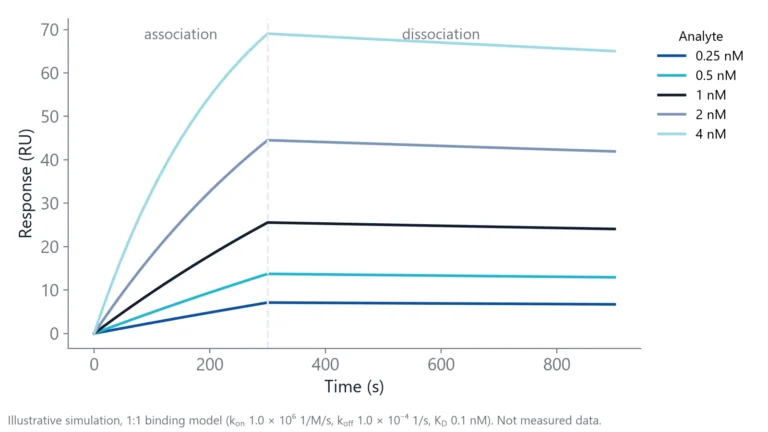
One trap: very fast interactions can look exactly like a bulk step, because the curve then follows the liquid exchange in the flow cell. A 1:1 model can fit such data very well and still tell you nothing about kon and koff [3]. If your binding curves are square, treat the rate constants with suspicion. In that case you can only say that binding and unbinding are faster than the liquid exchange in your flow cell. That gives lower limits for kon and koff, not values [3].
Two quick tests help. Inject a molecule that should not bind. After correct referencing or bulk correction it should give no signal [3]. To check the injection itself, inject a higher salt solution (0.05 M NaCl) and a plain flow buffer injection. The salt should give a sharp rise, a flat plateau and a sharp fall, and the buffer injection should be almost flat. A plateau that drops during the injection points to sample mixing with the flow buffer [4].
Why reference subtraction does not remove a buffer mismatch
The reference channel does not cancel a buffer mismatch, for two reasons.
The first is excluded volume. The ligand layer takes up part of the volume of the evanescent field. On the active surface, less solution is exchanged when the sample arrives, so the same bulk step gives a smaller signal there than on the reference [5]. After subtraction, a residual step remains. Normalization corrects for sensitivity differences between surfaces, but not for this excluded volume effect [7]. The size of this error depends on how thick and dense the surface layer is. In one study, a single-channel bulk correction that ignored the thickness of the surface layer overcorrected and gave negative binding signals [3].
The second is that sensing spots or flow cells do not respond identically. Small differences in signal linearity between surfaces also leave an offset [6].
You can reduce both errors with a better reference. An ideal reference surface resembles the active surface, for example a surface that was activated and deactivated without ligand [7]. Immobilizing an inactive form of the ligand, or a similar amount of a control protein, gives an even closer match [1].
A worked example from a fragment screening protocol shows the scale. On a solvent correction curve built from DMSO solutions with no compound, a point at 1000 RU on the reference surface sat at minus 8.2 RU after reference subtraction [6]. If your expected binding signal is a few RU, that error is larger than the answer.
Double referencing helps, but it is not a cure. Subtracting matched buffer blanks removes drift and remaining differences between channels [4,7]. It only works if the blank matches the sample, and it does not replace excluded volume correction in small molecule work [7]. Many artifacts are best minimized by designing the experiment well and then processing the data against reference surfaces [8].
Match the buffers before you inject
The best bulk correction is a bulk shift you never create. Using running buffer as the sample solvent keeps the effect small [1]. For kinetics with a concentration series, exchange the analyte buffer reliably, for example by dialysis or gel filtration [1]. For a simple yes or no binding test, exact matching is less critical [1].
A buffer matching checklist
- Dialyze or desalt the analyte into the running buffer.
- Keep the last dialysis buffer and use it as running buffer and dilution buffer [4].
- Prepare every concentration from the same stock and the same diluent.
- If the analyte needs DMSO, dialyze against buffer that contains the same DMSO concentration [4].
- Cap sample vials, because evaporation also causes jumps [4].
- Start with at least three buffer blank injections to settle the system [4].
- Prepare negative controls the same way as the samples, not from running buffer [6].
Watch the hidden sources of mismatch: glycerol from protein storage buffers, extra salt from elution, and imidazole or other additives left after purification.
When do you need solvent correction?
Reference subtraction handles bulk differences up to a few hundred RU. Above that you need solvent correction, which is the usual case with DMSO [6]. To check, inject DMSO solutions covering your sample range and plot active minus reference against reference. A flat line near zero means no correction. A slope means correct every sample.
DMSO is the usual case because even small differences in DMSO concentration give large jumps [4]. A 1% difference in DMSO between sample and running buffer typically gives about 1500 RU. A typical procedure uses four to eight solutions that bracket the DMSO content of your samples. You do not need to know their exact concentrations [6].
Preparing the DMSO series
A simple way to build the series is to make two buffers, one just below and one just above the DMSO content of your samples. Mix them in fixed volume steps to get evenly spaced solutions in between [6].
Repeat the calibration during long runs. In screening protocols, solvent correction is typically repeated every 50 cycles [6].
Small molecule assays on inQuiQ
Small molecule projects are where bulk effects hurt most: low binding signals, DMSO in every sample, and high compound concentrations. The inQuiQ benchtop biosensor has no lower molecular weight detection limit and a baseline noise below 0.1 RU RMS. Delta's small molecule interactions application note shows detection of a 250 Da compound binding to carbonic anhydrase II [9].
Signals that small still depend on the buffer matching and referencing steps above, because any sensor that reads refractive index in an evanescent field also sees the sample buffer. On inQuiQ, the reference is one of the 4 channels, and the sample flows through the reference and ligand channels in series, so every channel sees the same injection. For more on assay formats, see our page on small molecule binding affinity.
Questions researchers ask
How large a bulk shift is acceptable?
Handbook guidance varies with the assay. For general kinetics, shifts below about 10 RU are compensated well by the reference surface. In small molecule work, reference subtraction alone is said to handle differences of up to a few hundred RU, and larger DMSO mismatches need solvent correction. The smaller your binding signal, the tighter the match must be.
Why is my bulk shift negative?
In raw data, a negative step means the sample has a lower refractive index than the running buffer, for example less DMSO, salt or glycerol. In reference-subtracted data, a negative step can also come from a higher sample index, because the reference surface responds more strongly to the same bulk change. Matched buffers fix both.
Does glycerol in my protein stock cause a bulk effect?
Yes. Glycerol raises the refractive index strongly, which is why diluted glycerol is used to calibrate sensor surfaces. Even a few percent carried over from a storage buffer can give a large jump. Remove it by dialysis or desalting, or add the same glycerol concentration to the running buffer.
Can a small step remain even with perfectly matched buffers?
Yes. A tiny step can come from the injection itself, for example a small temperature difference between the sample and the flow system. A buffer blank injected with the same settings shows the size of this instrument step, so you can subtract it through double referencing instead of mistaking it for binding.
Do serum and plasma samples cause bulk shifts?
Yes, and often large ones, because they contain high concentrations of protein, salt and other solutes. A practical approach is to dilute standards and blanks in the same matrix at the same dilution as your samples, so the matrix contributes equally to every injection and to the reference.
References
- Real-Time Analysis of Biomolecular Interactions. Springer Japan. 2000. doi:10.1007/978-4-431-66970-8
- Kindt JT, Bailey RC. Biomolecular analysis with microring resonators: applications in multiplexed diagnostics and interaction screening. Curr Opin Chem Biol. 2013. doi:10.1016/j.cbpa.2013.06.014
- Svirelis J, Andersson J, Stradner A et al.. Accurate Correction of the "Bulk Response" in Surface Plasmon Resonance Sensing Provides New Insights on Interactions Involving Lysozyme and Poly(ethylene glycol). ACS Sens. 2022. doi:10.1021/acssensors.2c00273
- Marquart JA. SPRpages – Getting a Feeling for the Curves. Handbook of Surface Plasmon Resonance. 2017. doi:10.1039/9781788010283-00106
- Questions and Answers. Handbook of Surface Plasmon Resonance. 2017. doi:10.1039/9781788010283-00479
- Karlsson R, Karlsson O, Belcher P. Fragment and Low Molecular Weight Compound Analysis. Handbook of Surface Plasmon Resonance. 2017. doi:10.1039/9781788010283-00255
- Ditto NT, Eckman J. Treating Raw Data: Software for SPR Applications. Handbook of Surface Plasmon Resonance. 2017. doi:10.1039/9781788010283-00328
- Myszka DG. Improving biosensor analysis. J Mol Recognit. 1999. doi:10.1002/(SICI)1099-1352(199909/10)12:5<279::AID-JMR473>3.0.CO;2-3
- Delta Life Science. Small Molecule Interactions. Application note. Link
Keep reading
 Baseline drift in a biosensor: why it happens and how to stop itBaseline drift is often blamed on the chip. A short buffer-only test shows whether the surface, the buffer or the instrument is the real cause.Assay setup
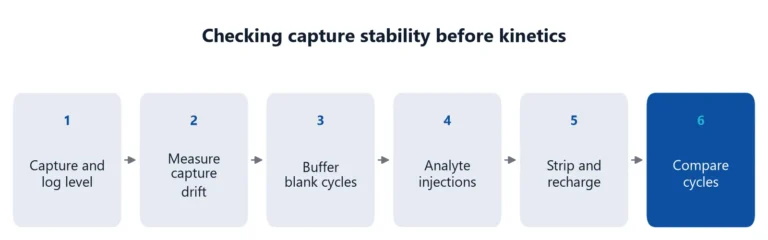 His tag capture assay: what to check when capture levels driftHis-tag capture is fast and reversible, but the ligand keeps leaving the surface. How to measure that drift, keep it apart from the analyte interaction, and reduce it.Applications
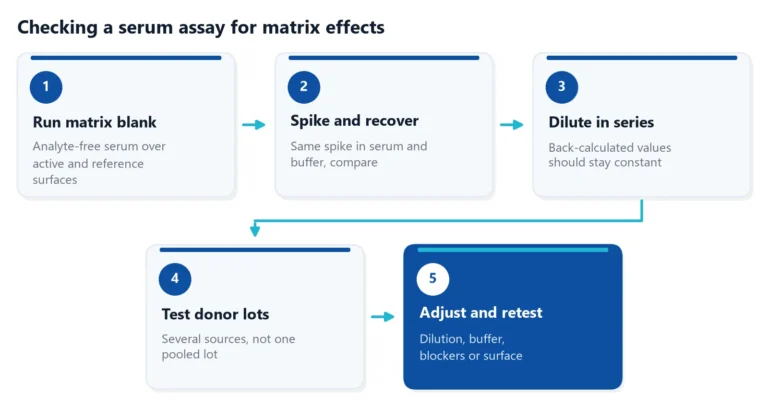 Matrix effects in binding assays: how serum changes your signalSerum can raise, lower or blur the signal of a binding assay. Learn where matrix effects come from, how to test for them, and how to reduce them in ELISA and label-free assays.