
On this page
Questions about your own assay?
Ask a specialistThe dissociation constant (KD) is the concentration at which half of the binding sites are occupied. A lower KD means tighter binding, and it equals the off-rate divided by the on-rate. A KD is only as reliable as the measurement behind it: confirm that binding reached equilibrium and that concentrations sit around the KD.
KD tells you how tightly two molecules hold on
When two molecules bind, complexes form and break up all the time. The dissociation constant puts one number on that balance, and it is easy to report a wrong one.
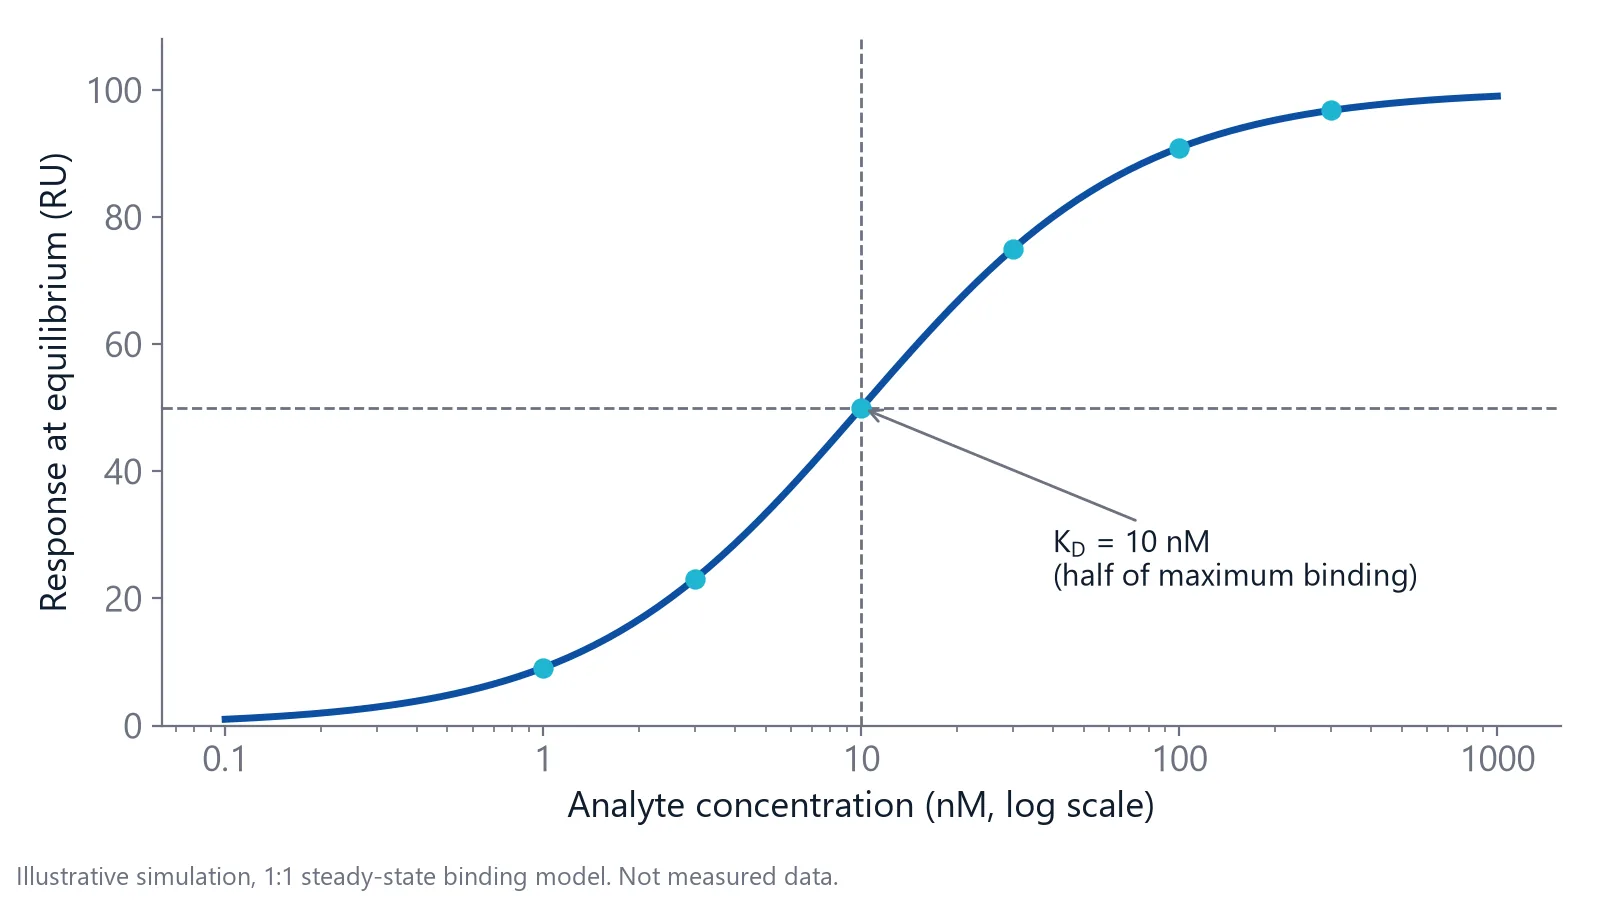
Take a simple 1:1 interaction between molecules A and B. The dissociation constant (KD) is the product of the free A and free B concentrations divided by the complex concentration, all at equilibrium. Its unit is molar (M), and a lower KD means tighter binding [1]. KD is also the free concentration of B at which half of the binding sites on A are occupied [3].
KD links two rate constants. The association rate constant (kon, in 1/M/s) says how fast complexes form. The dissociation rate constant (koff, in 1/s) is the chance per second that one complex falls apart [1]. At equilibrium both rates are equal, so KD = koff / kon. The inverse, 1/KD, is the association constant (Ka) in 1/M.
What does a dissociation constant value mean in the lab?
A dissociation constant tells you two things at the bench: how much complex you get at the concentration you work at, and how long one complex lasts. The first follows from KD alone. The second needs the koff behind it.
For 1:1 binding, occupancy follows directly from the ratio of the free partner concentration to KD:
- At 0.1 times KD, about 9% of sites are bound
- At 1 times KD, 50% are bound
- At 10 times KD, about 91% are bound
So a 10 nM binder used at 1 nM leaves most of its target free. To come close to saturation, you need about 100 nM.
Lifetime follows from koff. Association rate constants for proteins fall in a narrow window, often 106 to 107 1/M/s, so koff usually decides the affinity [1]. The table assumes a kon of 106 1/M/s.
| KD | koff (1/s) | Half-life of the complex |
|---|---|---|
| 1 mM | 1,000 | 0.7 ms |
| 1 µM | 1 | 0.7 s |
| 1 nM | 0.001 | about 12 min |
| 1 pM | 0.000001 | about 8 days |
A koff of 0.001 1/s means about 0.1% of the complexes dissociate every second. This is why micromolar complexes come and go within a second, while nanomolar complexes last for minutes [1].
Two binders with the same KD can behave very differently
KD is a ratio, so it hides the rates behind it. A binder with a kon of 106 1/M/s and a koff of 0.01 1/s has the same 10 nM KD as one with a kon of 105 1/M/s and a koff of 0.001 1/s. The second complex lasts ten times longer.
That difference matters outside the test tube. In drug discovery, slower dissociation is one way to keep a target occupied after the free drug concentration drops [7]. A KD from an equilibrium experiment alone tells you nothing about these rates [1].
If you compare antibody clones, look at koff next to KD. Ranking antibody clones by off-rate is covered in antibody affinity and kinetics.
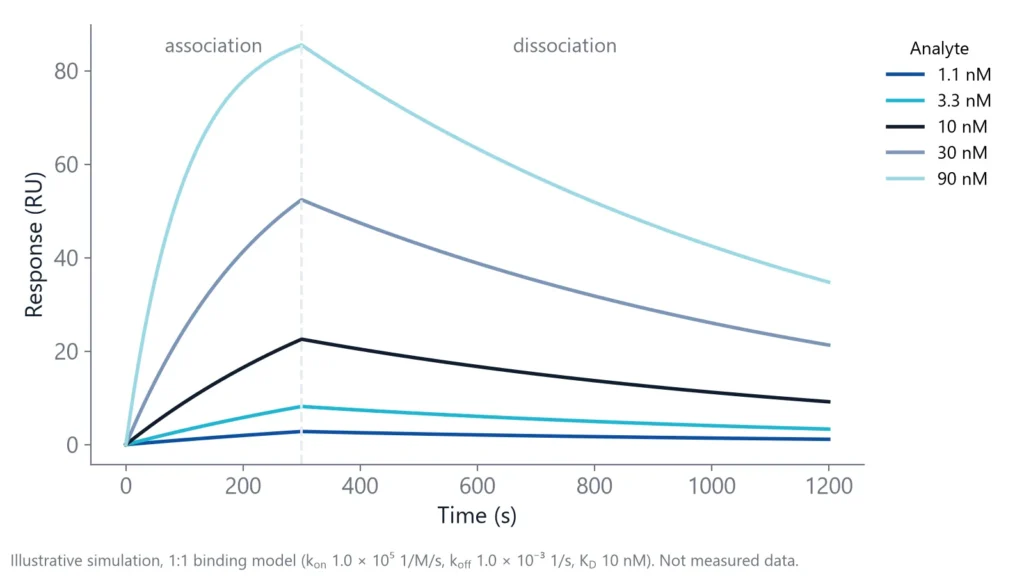
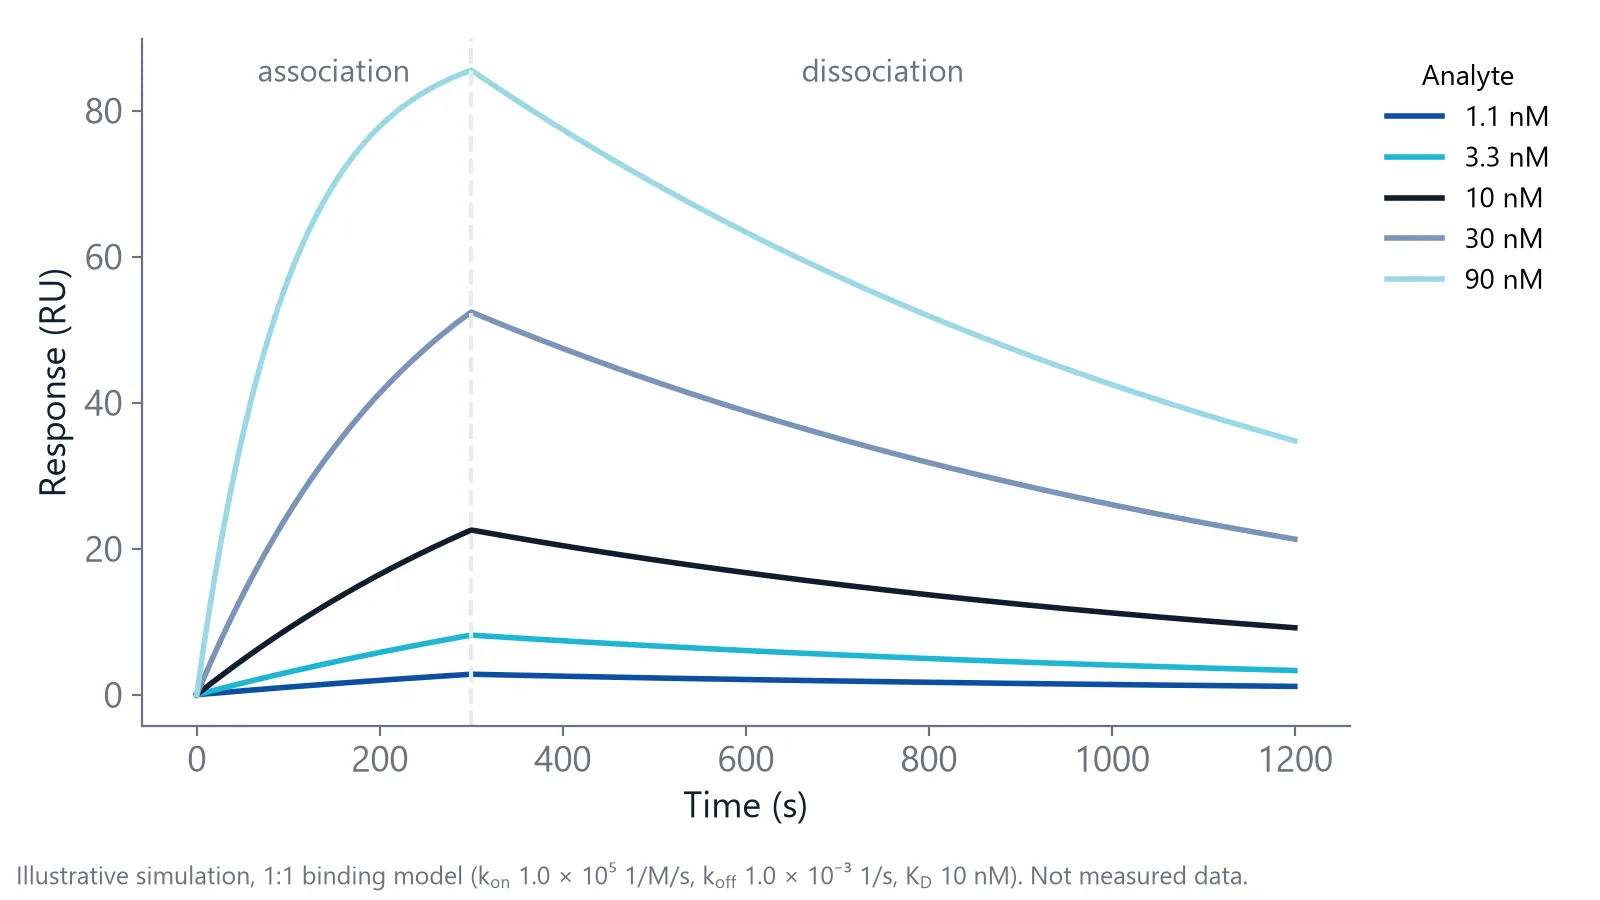
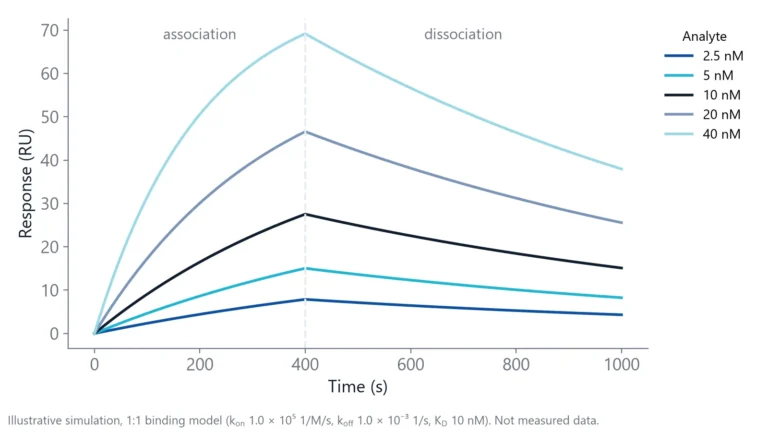
A sensorgram, the binding signal plotted over time, shows the rates directly. The figure simulates the slower binder at five concentrations.
How is the dissociation constant measured?
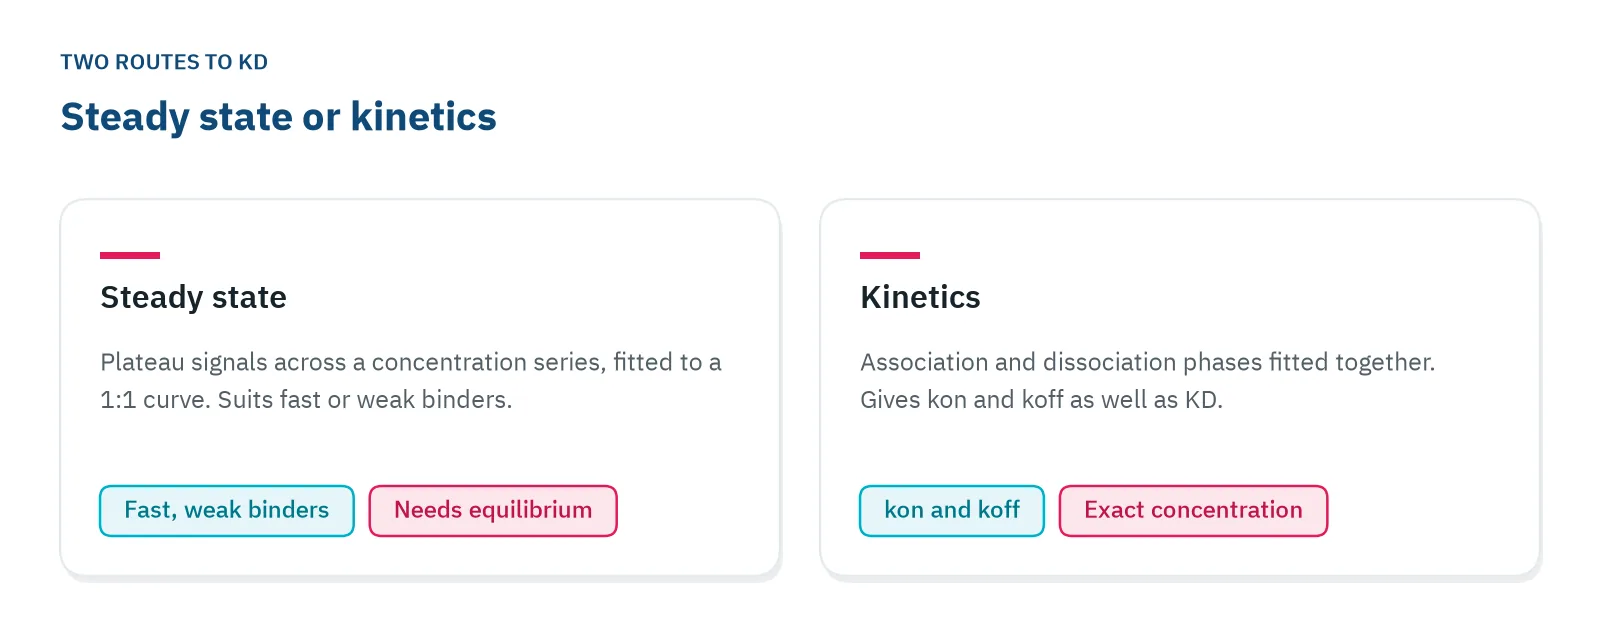
You measure KD in one of two ways: from how much complex forms at equilibrium across a range of concentrations, or from the association and dissociation rates, with KD = koff / kon [1].
Label-free biosensors give you both from one experiment. One partner, the ligand, is attached to a sensor surface. The other, the analyte, is brought to it in solution. The signal rises while analyte binds (association) and falls once buffer replaces the sample (dissociation) [5]. A reference channel without the ligand records signal from the buffer and the bare surface, which you subtract.
Surface plasmon resonance (SPR), biolayer interferometry (BLI), grating-coupled interferometry (GCI) and Nanophotonic Evanescent field Sensing (NES) all measure binding this way, with one partner on the surface. For the physics, see how photonic biosensing works.
From steady state
Inject a series of analyte concentrations and wait until each signal levels off. Plot the plateau signal against concentration and fit a 1:1 binding curve. The fit returns KD and the signal at saturation (Rmax). The series should span about 0.1 to 10 times KD [4], and each signal must be at equilibrium (see the checks below). Five concentrations in threefold steps around your best guess is a common start.
Steady state is the better choice when binding is so fast or so weak that the rates are hard to read [5]. That makes it the usual route for weak binders such as fragments; see small molecule binding affinity.
From kinetics
Fit the association and dissociation phases of all concentrations together, to one kon and one koff. koff comes from the dissociation phase and does not depend on analyte concentration, but kon and KD need an accurate analyte concentration [3]. Label-free biosensors such as inQuiQ report KD, kon and koff from the same run.
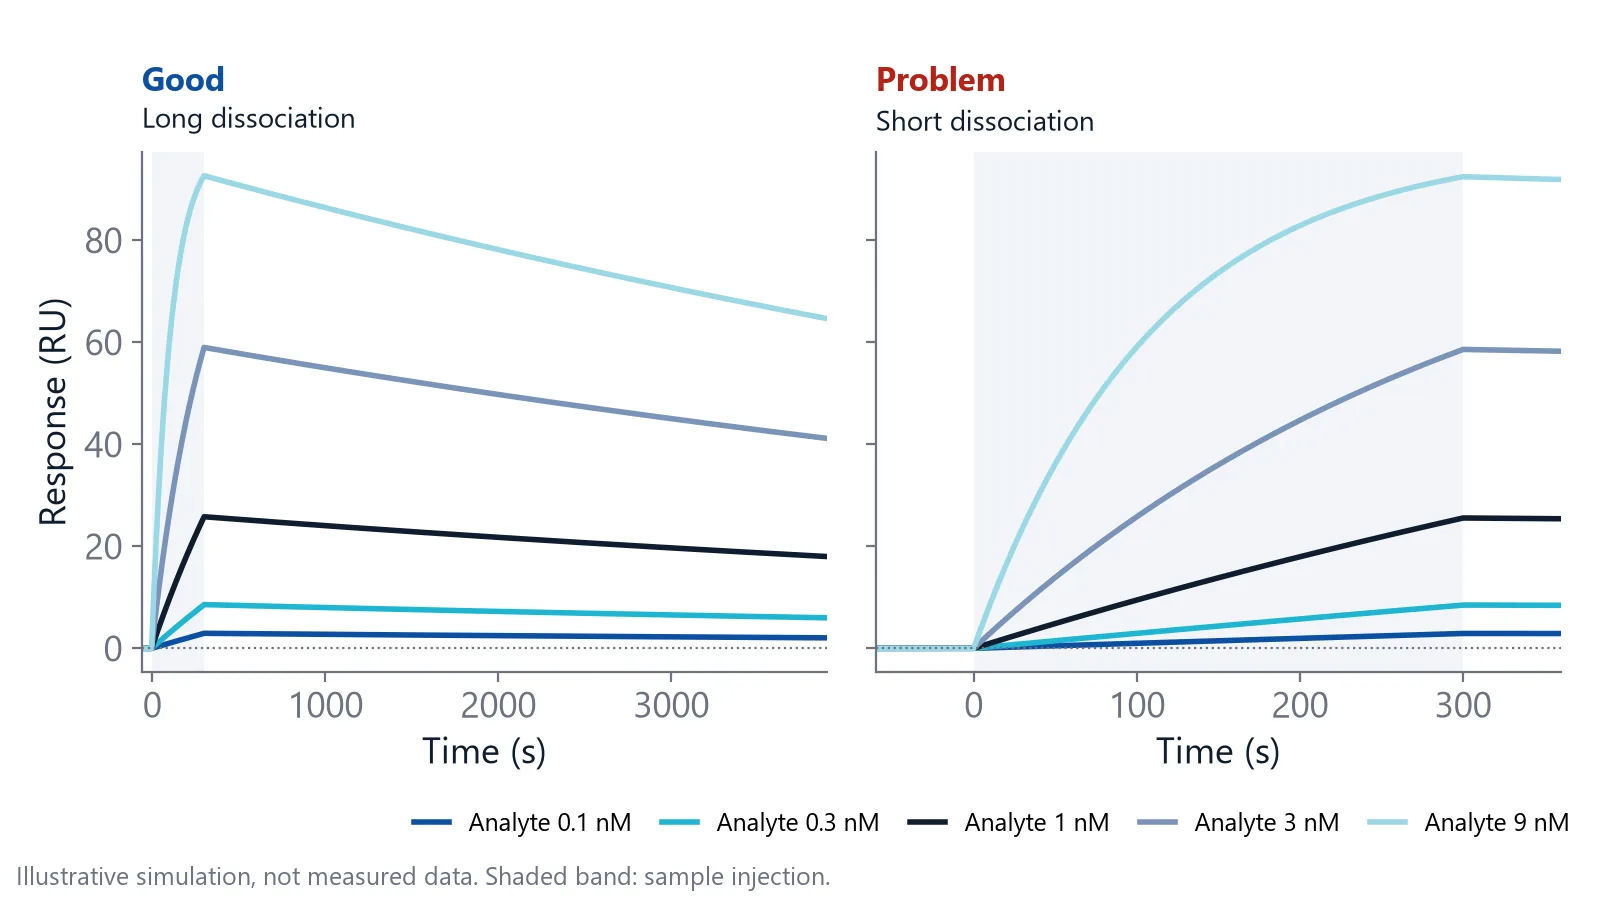
Kinetics is the better choice for tight binders, because they take very long to reach steady state. With a koff of 10-4 1/s, a concentration equal to KD needs close to 10 hours to get within 0.1% of steady state [3]. Tight binders also need a long dissociation phase. At that koff, only about 3% of the complex dissociates in five minutes, too little to pin down koff, since the handbook advises at least 5% decay [3].
Run these checks before you trust a KD
Many published KD values come without the controls that show they are right. In a survey of 100 binding studies, most did not document checks of incubation time or concentration regime [2]. Run them on your own data.
- Equilibrium was reached. Binding approaches equilibrium most slowly at the lowest concentration, where the rate is set by koff. Allow five half-lives, and vary the incubation or contact time, ideally tenfold, to confirm the signal no longer changes [2].
- The KD does not move with the fixed partner. If the partner you hold constant is far above KD, the midpoint of your curve reports half of its active concentration, not the KD. Change its concentration. A valid KD stays put [2].
- The protein is active. If only 10% of the partner you titrate can bind, its real concentration is ten times lower than you think and the apparent KD is ten times too high [2]. Inactive ligand on the sensor surface lowers Rmax instead.
- The conditions are stated. The affinity of one RNA-binding protein differed 100-fold between 0 °C and 25 °C [2]. Report temperature, salt and pH with every KD.
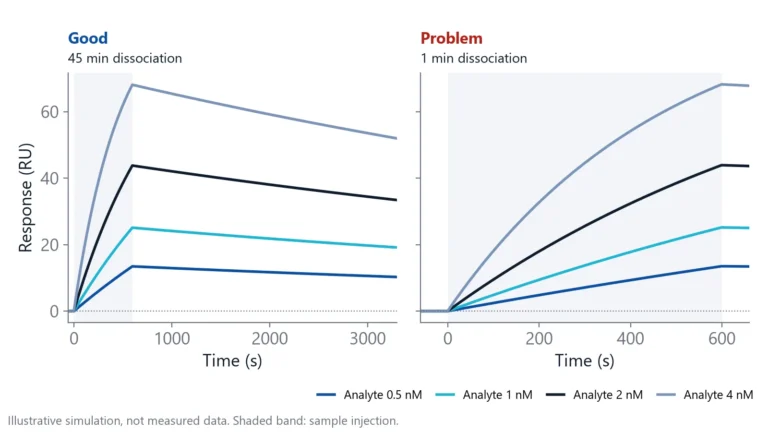
- The surface did not change the answer. On a biosensor, rebinding (released analyte binds again before it leaves the surface), mass transport (analyte cannot reach the surface fast enough), non-specific binding and binding that is not 1:1 can make the measured constant differ from the value in solution [6]. Delta's Measuring Tight Binders note compares a short and a long dissociation protocol for an antibody.
- A second method agrees. Measuring KD by an independent approach catches artifacts of one technique. In one study, kinetic and equilibrium KD values agreed within twofold [2].
If a KD passes these checks, it describes the interaction. If not, it describes the experiment.
Questions researchers ask
Is KD the same as IC50?
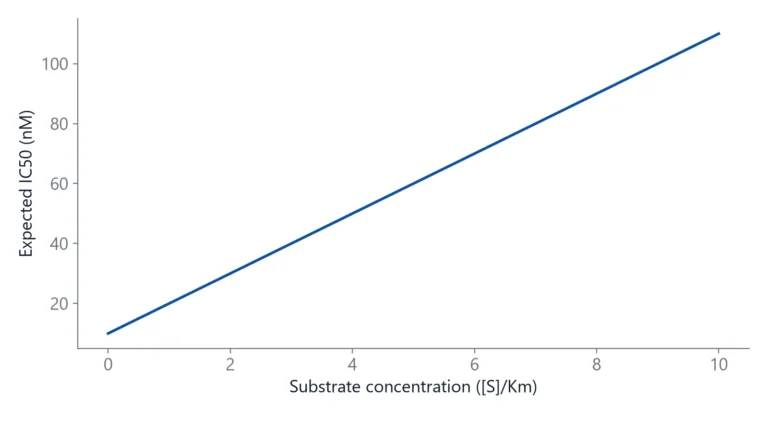
They answer different questions. IC50 is the inhibitor concentration that halves a signal in a specific assay, so it shifts with the substrate or competitor concentration and the readout. KD describes the binding of two molecules under given conditions. For a competitive inhibitor you can convert IC50 to an inhibition constant, but only when you know the assay concentrations.
What is the difference between KD and Km?
Km, the Michaelis constant, is the substrate concentration at which an enzyme runs at half its maximum rate. It includes the catalytic step, not just binding and release. Km approaches the KD of the enzyme and substrate only when catalysis is much slower than dissociation, so do not read a Km as an affinity by default.
Is a lower KD always better?
That depends on what the binder is for. A capture reagent that binds too tightly can be hard to elute or regenerate without damage. For a drug or probe, selectivity against related targets can matter more than the last tenfold in affinity. Decide which KD range your application needs before you optimize toward the lowest value.
Is a binding KD the same as an acid dissociation constant?
The math is the same, the reaction is different. An acid dissociation constant describes an acid releasing a proton in water and is usually given as pKa. A binding KD describes a complex of two molecules, such as a protein and a ligand, falling apart. Search results often mix the two, so check which one a source means.
Can I get a KD from a single analyte concentration?
You can estimate one, but you cannot trust it. A single curve cannot show whether binding follows a 1:1 model, whether the surface behaves, or whether the concentration was right. A series of concentrations fitted together tests the model, and a mismatch between curves tells you something is wrong before you report a number.
References
- Pollard TD. A guide to simple and informative binding assays. Mol Biol Cell. 2010. doi:10.1091/mbc.E10-08-0683
- Jarmoskaite I, AlSadhan I, Vaidyanathan PP et al.. How to measure and evaluate binding affinities. Elife. 2020. doi:10.7554/eLife.57264
- Handbook of Surface Plasmon Resonance. The Royal Society of Chemistry. 2017. doi:10.1039/9781788010283
- Marquart JA. SPRpages – Getting a Feeling for the Curves. Handbook of Surface Plasmon Resonance. 2017. doi:10.1039/9781788010283-00106
- Real-Time Analysis of Biomolecular Interactions. Springer Japan. 2000. doi:10.1007/978-4-431-66970-8
- Schasfoort RBM. Future Trends in SPR Technology. Handbook of Surface Plasmon Resonance. 2017. doi:10.1039/9781788010283-00415
- Tonge PJ. Drug-Target Kinetics in Drug Discovery. ACS Chem Neurosci. 2018. doi:10.1021/acschemneuro.7b00185
Keep reading
 KD vs IC50: how binding affinity and inhibition differKD describes a binding pair, IC50 describes an inhibitor in one assay. Here is how they relate, when you can convert one into the other, and what kinetics add.Label-free 101
 How to read a sensorgram: baseline, association, dissociationA sensorgram shows binding as it happens. Learn what each phase means, what the height and shape of the curve tell you, and which artifacts to remove before you fit.Method comparisons
 Biolayer interferometry vs SPR: which method fits your assayBoth methods measure binding label-free and in real time. The sample path, flow over a chip or a tip in a well, decides which one suits your hardest measurement.