
On this page
Questions about your own assay?
Ask a specialistKD describes how tightly two molecules bind at equilibrium. IC50 describes how much inhibitor halves a signal in one specific assay, so it moves when the assay changes. Convert IC50 only when the mechanism and conditions allow it, and measure KD directly when you need to compare compounds across assays.
KD vs IC50: two numbers for two different questions
Drug discovery teams describe a compound with two kinds of numbers: how tightly it binds its target, and how well it blocks a function. The KD vs IC50 question comes up when someone puts the two side by side and they do not match.
The equilibrium dissociation constant, KD, belongs to a binding pair. It is the concentration of free molecule at which half of its binding partner is occupied at equilibrium, given in molar units. A KD of 10 nM means half of the target is bound when 10 nM of the compound is free in solution. Lower KD means tighter binding.
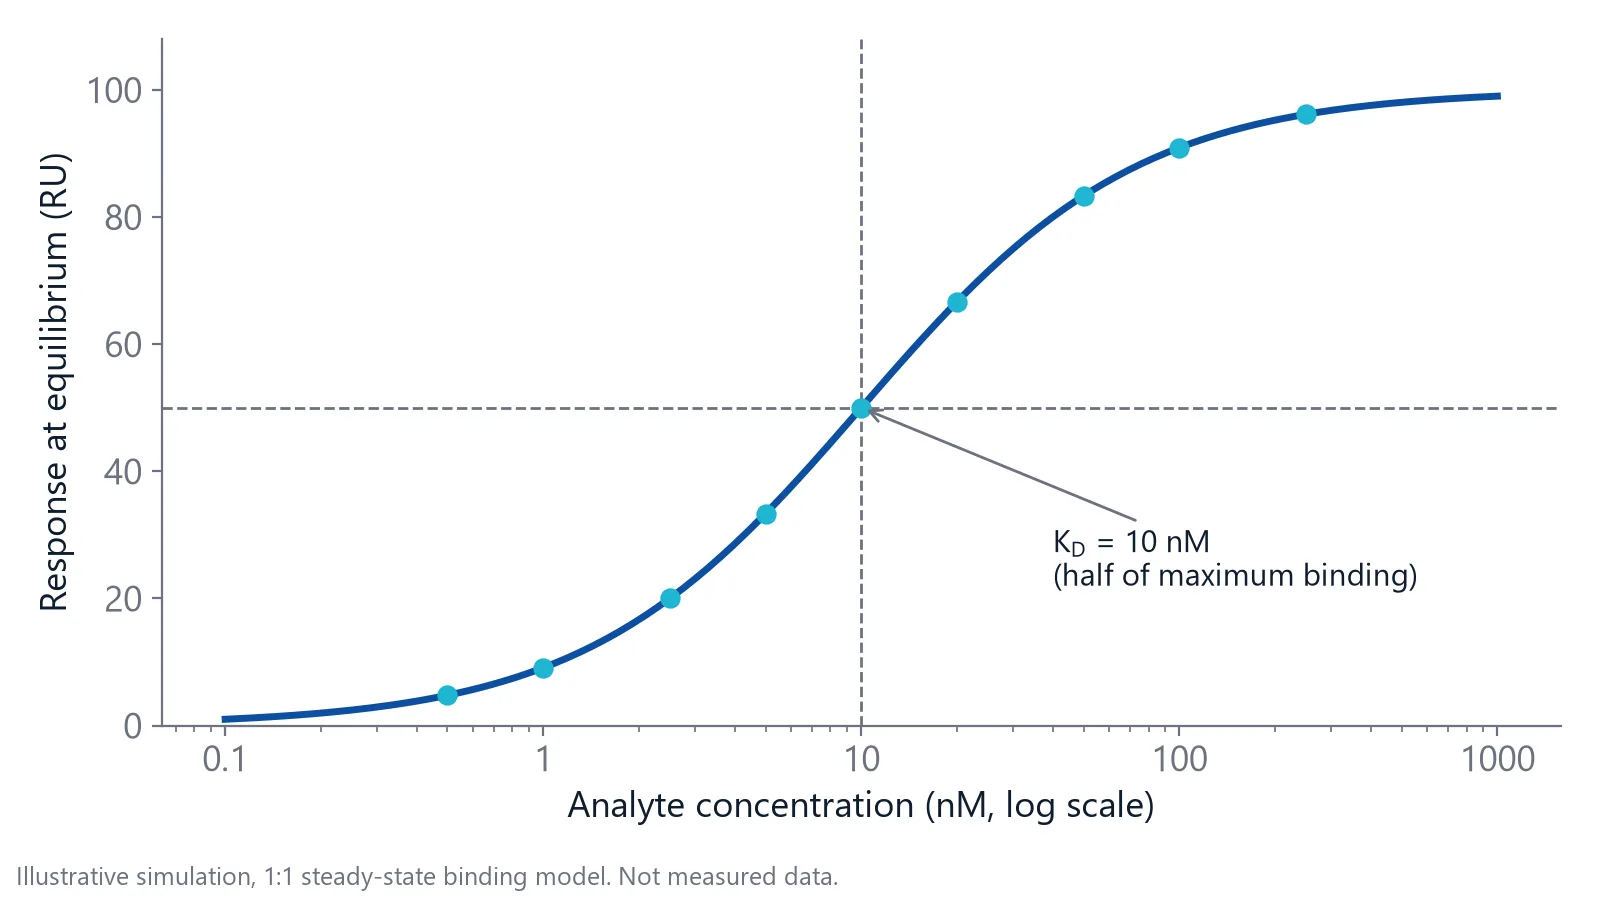
KD also connects to speed. The association rate constant, kon (1/M/s), says how fast the complex forms. The dissociation rate constant, koff (1/s), says how fast it falls apart. KD equals koff divided by kon.
The half maximal inhibitory concentration, IC50, belongs to an assay. It is the inhibitor concentration that reduces a measured signal, such as enzyme activity or the binding of a partner protein, to half. Change the assay and the same compound can give a different IC50 [2].
| Value | What it describes | Changes with assay conditions? | How you get it |
|---|---|---|---|
| KD | Binding of two molecules at equilibrium | Little | Direct binding: titration or kinetics |
| Ki | The KD of an inhibitor for its target | Little, if the assumed mechanism is right | Calculated from IC50, or fitted from inhibition data |
| IC50 | Inhibitor concentration that halves a signal | Yes: substrate or tracer, target concentration, time | Dose-response curve in one assay |
Even KD is not a pure constant. Buffer composition and temperature change measured affinities, so report both with every value [3].
IC50 moves when the assay changes
Most KD vs IC50 mismatches start with the substrate. A competitive inhibitor fights the substrate, or a labeled tracer, for the same site. Add more substrate and you need more inhibitor to reach half inhibition. The Cheng-Prusoff equation describes this: IC50 = Ki × (1 + [S]/Km), where [S] is the substrate concentration and Km is the substrate's Michaelis constant, the substrate concentration that gives half the maximal reaction rate [2].
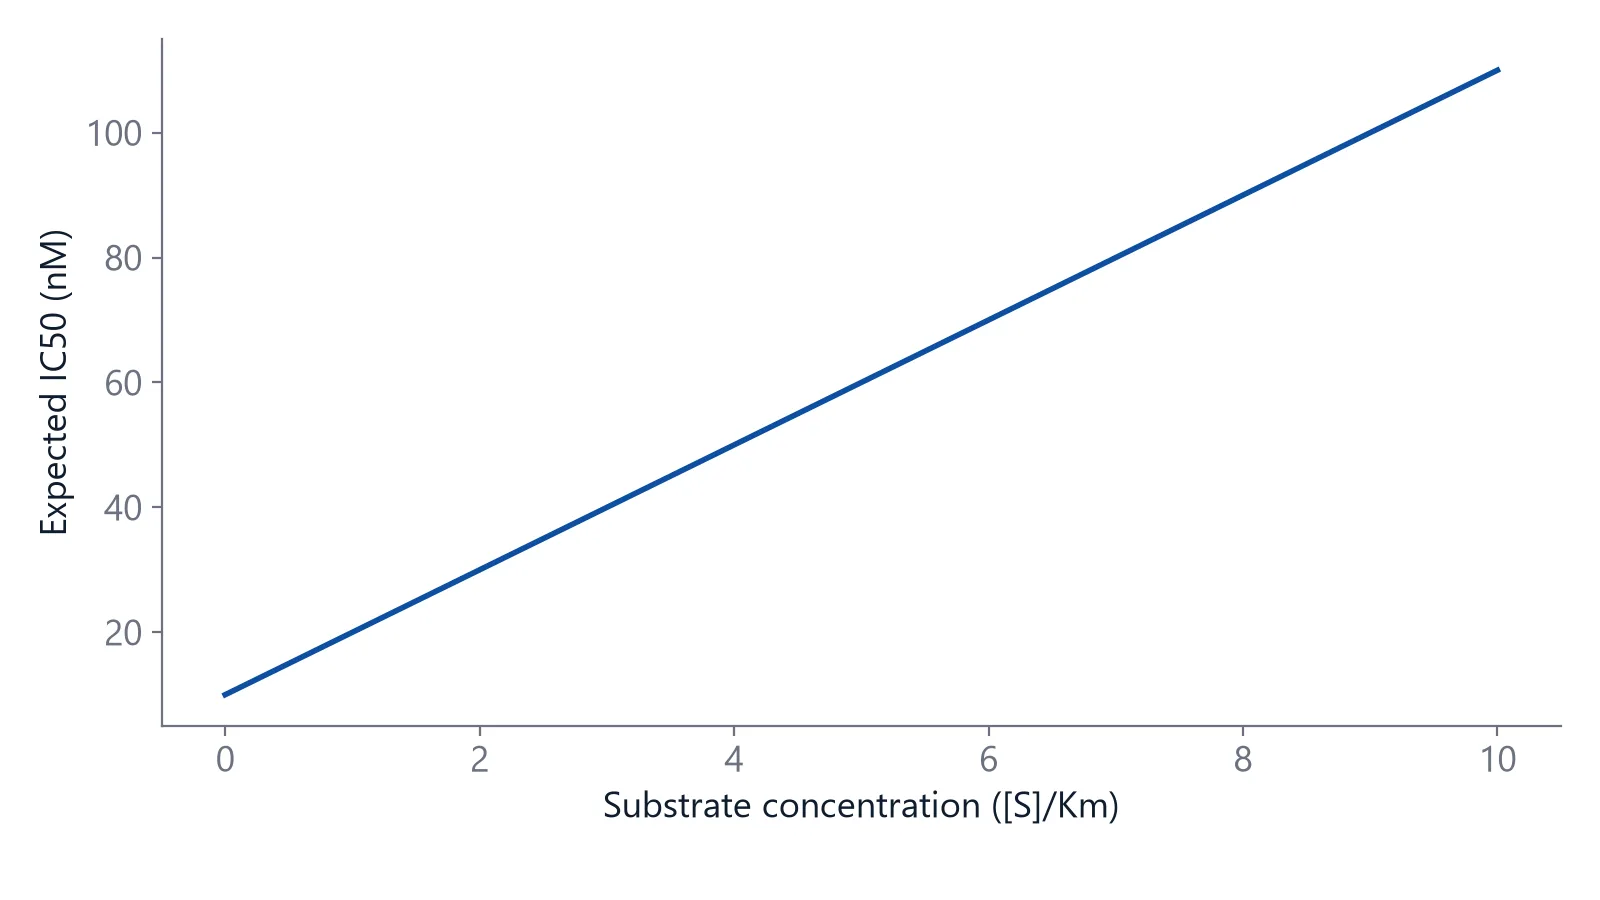
Substrate is not the only lever:
- Target concentration. A high protein concentration raises the apparent IC50 (see the depletion check below).
- Signal window. A competition assay needs enough tracer signal, and that can set an upper limit on the affinity it can report [3].
- Incubation time. A competition read before equilibrium gives a value that depends on when you read it [4].
- Mechanism. Allosteric and other noncompetitive inhibitors do not shift with substrate the way competitive ones do [2,3].
- Cells. A cell-based IC50 adds uptake, protein binding and downstream signaling on top of binding.
How do you convert IC50 to Ki or KD?
For a competitive inhibitor measured at equilibrium, divide the IC50 by (1 + [S]/Km), or by (1 + [L]/KD) for a labeled tracer at concentration [L]. The result is Ki, the inhibitor's own dissociation constant for the target. Outside these conditions the equation still returns a number, but not a reliable one [2,4].
Run the substrate at its Km and the correction is a factor of 2: Ki is half the IC50. Many screening assays use this balanced condition because it detects inhibitors with different mechanisms [2].
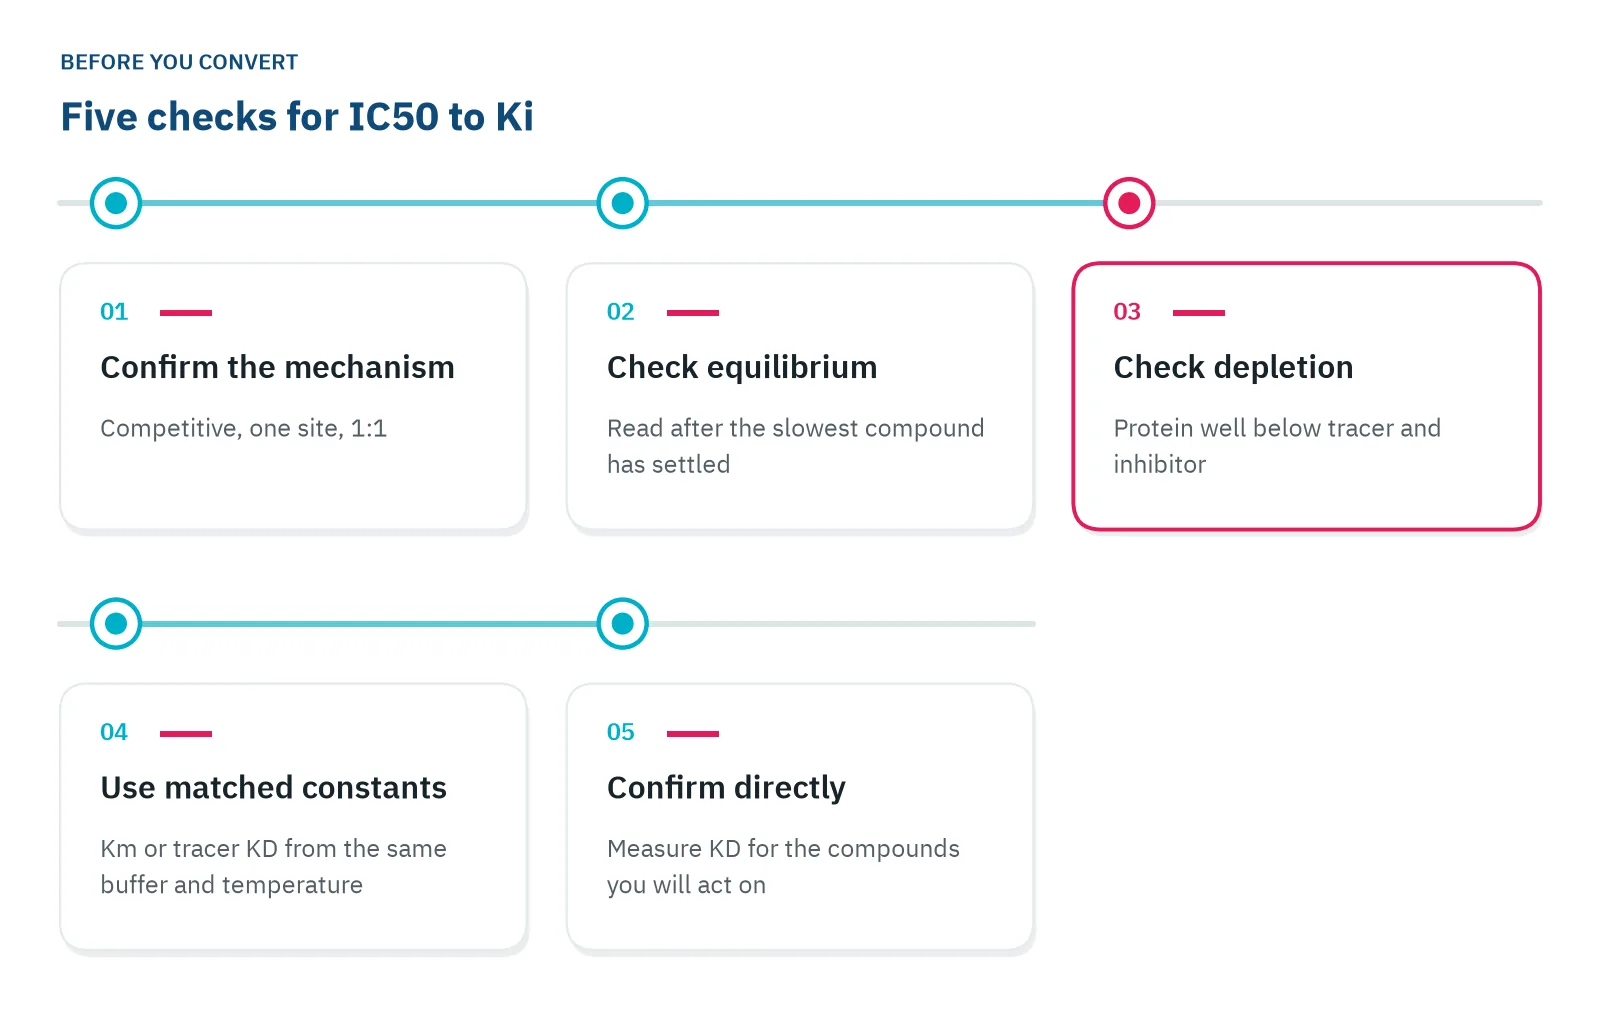
The equation also assumes that both tracer and inhibitor are in large excess over the protein. When protein is not well below the inhibitor, it binds up inhibitor and the apparent IC50 rises. In a simulation study, the simple equation lost accuracy when this condition failed, while an exact equation (Wang's) gave the best Ki estimates across all conditions tested [4]. Use a Km or tracer KD measured in the same buffer and at the same temperature as the assay. Run these checks before you convert, and test whether the inhibitor is competitive or allosteric first [3]:
Can you compare IC50 values from different studies?
Only roughly. In an analysis of public IC50 data for identical protein and compound pairs, about 68% of independent measurements agreed within a factor of 4.8 [2]. That is good enough for large data sets, but too coarse to rank two close analogs.
Within one lab and one assay, the spread is much smaller. The same study found standard deviations of 0.22 and 0.17 log units for two reference inhibitors measured repeatedly in-house, against 0.68 log units for mixed public data [2].
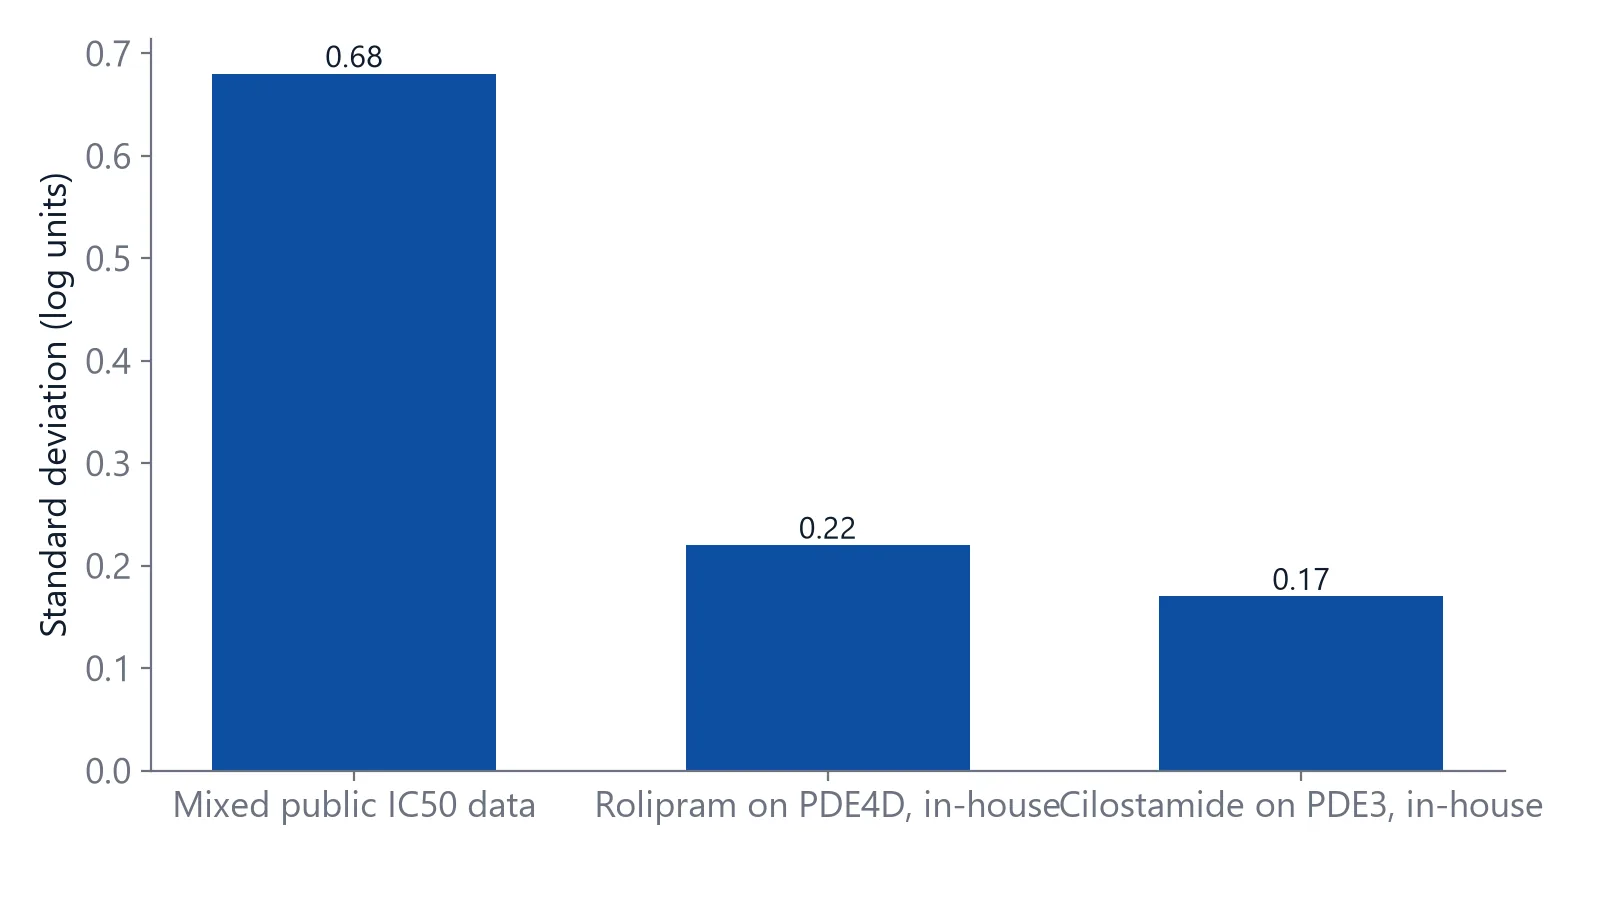
The authors also traced many large differences to database errors: wrong units, wrong receptor subtypes and cell assays filed as biochemical ones. Across the database, Ki values were on average about 2.3 times lower than IC50 values for the same pair, close to the factor of 2 expected at [S] = Km [2].
For direct affinity measurement, see small molecule binding affinity.
Kinetics show what KD and IC50 both hide
Two compounds with the same KD can behave very differently. In the simulation below, kon is 1 × 10⁵ 1/M/s and koff is 0.001 1/s, which gives a KD of 10 nM. A compound with kon 1 × 10⁶ 1/M/s and koff 0.01 1/s has the same KD, but leaves ten times faster.
Residence time, 1/koff, is how long a complex lasts on average [5]. At koff 0.001 1/s it is about 17 minutes. At 0.01 1/s it is under 2 minutes. Slow dissociation can keep a target occupied after free drug levels fall, which no equilibrium number shows [6].
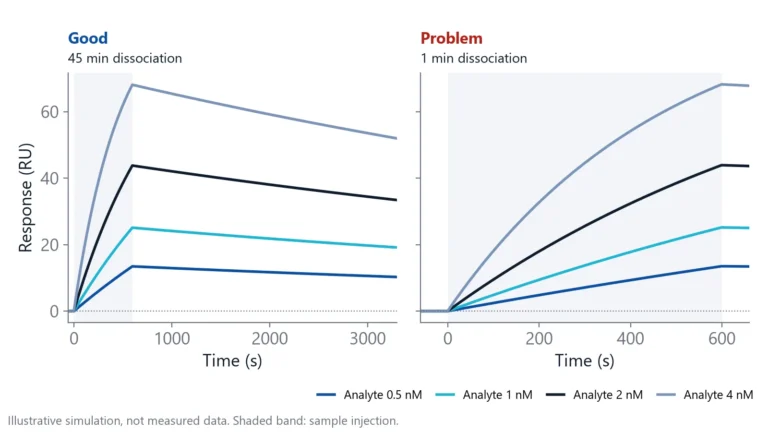
A label-free biosensor measures these rates directly. One binding partner, the ligand, is fixed to a sensor surface. The other, the analyte, flows over it, and the instrument records binding in real time as a sensorgram: a rising association phase while analyte flows, then a falling dissociation phase in buffer. Fitting a concentration series gives kon and koff, and from them KD [1].
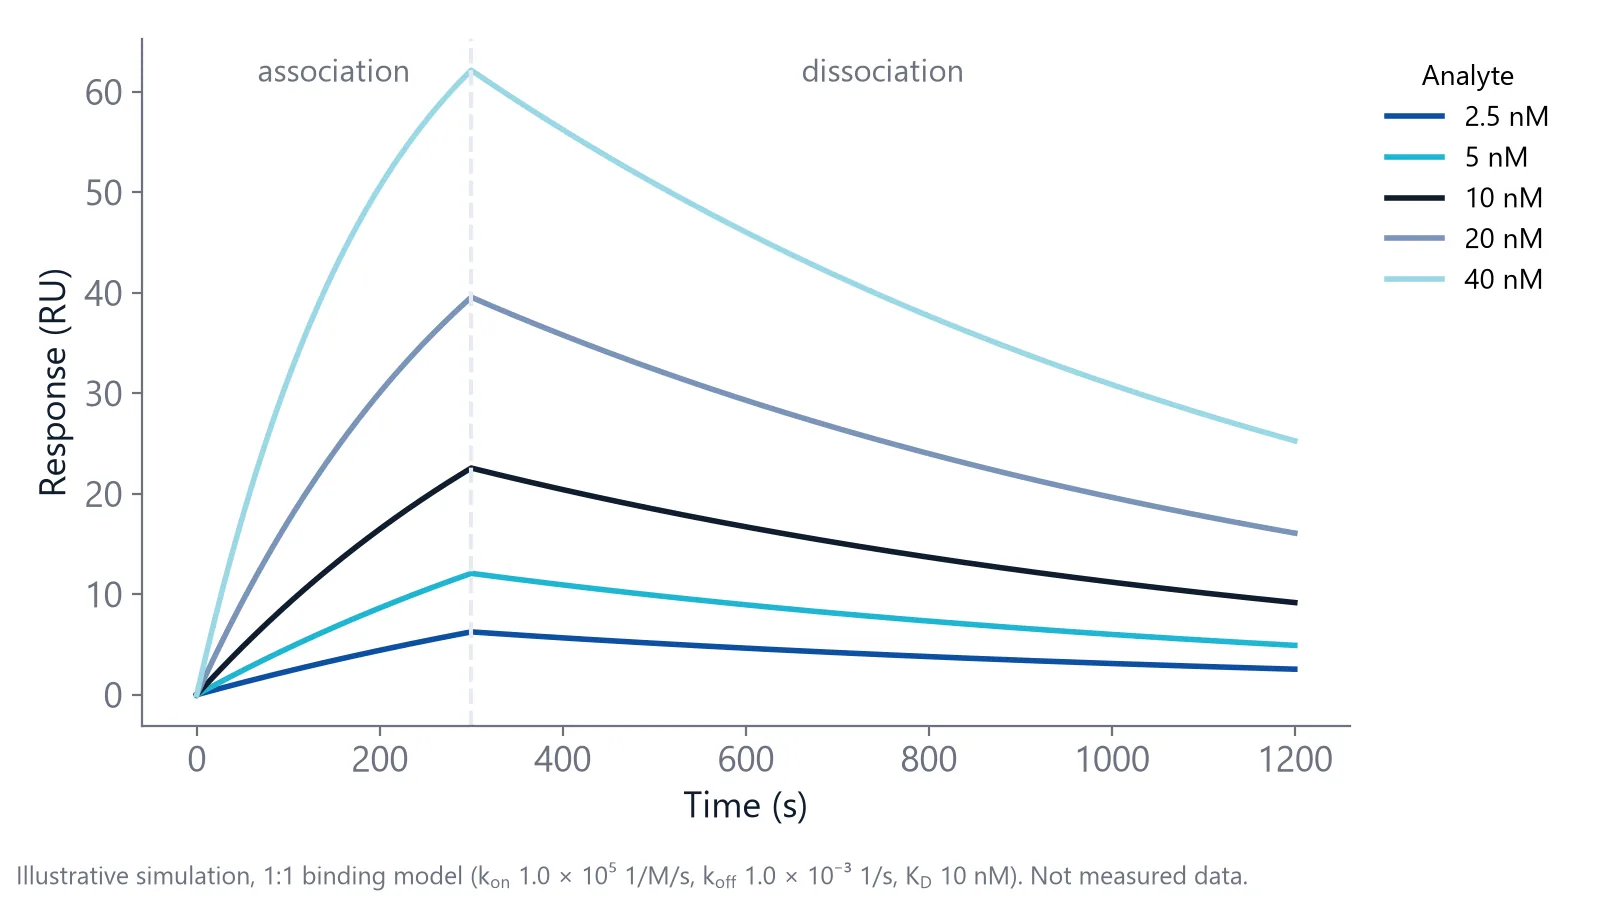
Methods in this class include surface plasmon resonance (SPR), biolayer interferometry (BLI), grating-coupled interferometry (GCI) and Nanophotonic Evanescent field Sensing (NES), the integrated photonics method behind Delta's inQuiQ.
Measure both numbers on one biosensor
The same instrument can give you KD and IC50. For KD, fix the target and inject the compound at several concentrations. For IC50, premix the target with a dilution series of inhibitor, then inject the mixtures over a surface that carries the target's binding partner. Free target binds the surface and target held by the inhibitor does not, so the signal drops as inhibitor concentration rises [7].
PD-1 and PD-L1 make the KD vs IC50 difference concrete. Delta application notes report a KD of 37.7 nM for the PD-1/PD-L1 interaction [8] and an IC50 of 8.2 nM for its inhibition by BMS-1166 [9]. The KD describes the protein pair. The IC50 describes the small molecule in that assay, and it is not the KD of BMS-1166 for its target.
Choose the number by the question you ask:
- IC50 to rank compounds inside one assay series
- Ki or KD to compare across assays, labs or targets
- kon and koff when how long a compound stays bound matters
Questions researchers ask
What is the difference between IC50 and EC50?
EC50 is the concentration that gives half of the maximal effect, whether the compound activates or inhibits. IC50 is used for inhibition only. For a compound that inhibits fully, the two are the same. For a partial inhibitor that never reaches 50% inhibition, no IC50 exists, but an EC50 can still be fitted.
Is a lower IC50 always better?
Within one assay, a lower IC50 means a more potent compound. It says nothing about selectivity, how long the compound stays bound or how it behaves in cells. A slightly weaker compound with a slower off-rate or a cleaner selectivity profile can be the better lead, so judge potency together with those properties.
How many concentrations do you need for a reliable IC50?
Use 8 to 12 concentrations, spaced two to three fold, so the curve shows a clear top and bottom plateau. Center the series on the expected IC50. Without both plateaus the fit has to guess the maximum and minimum signal, and the IC50 can shift by a large factor between repeats.
What does the Hill slope of an IC50 curve tell you?
Simple 1:1 inhibition gives a Hill slope close to 1, with 10% to 90% inhibition over about two log units. A much steeper curve can point to aggregation or tight binding, a much shallower one to several binding sites. To test it, refit with the Hill slope fixed at 1 and compare the two IC50 values.
References
- Real-Time Analysis of Biomolecular Interactions. Springer Japan. 2000. doi:10.1007/978-4-431-66970-8
- Kalliokoski T, Kramer C, Vulpetti A et al.. Comparability of mixed IC₅₀ data - a statistical analysis. PLoS One. 2013. doi:10.1371/journal.pone.0061007
- Hulme EC, Trevethick MA. Ligand binding assays at equilibrium: validation and interpretation. Br J Pharmacol. 2010. doi:10.1111/j.1476-5381.2009.00604.x
- Du Y. Binding Curve Viewer: Visualizing the Equilibrium and Kinetics of Protein-Ligand Binding and Competitive Binding. J Chem Inf Model. 2024. doi:10.1021/acs.jcim.4c00130
- Bernetti M, Masetti M, Rocchia W et al.. Kinetics of Drug Binding and Residence Time. Annu Rev Phys Chem. 2019. doi:10.1146/annurev-physchem-042018-052340
- Tonge PJ. Drug-Target Kinetics in Drug Discovery. ACS Chem Neurosci. 2018. doi:10.1021/acschemneuro.7b00185
- Karlsson R, Karlsson O, Belcher P. Fragment and Low Molecular Weight Compound Analysis. Handbook of Surface Plasmon Resonance. 2017. doi:10.1039/9781788010283-00255
- Delta Life Science. PD-1/PD-L1 Interaction. Application note. Link
- Delta Life Science. PD-1/PD-L1 Inhibition with BMS-1166. Application note. Link
Keep reading
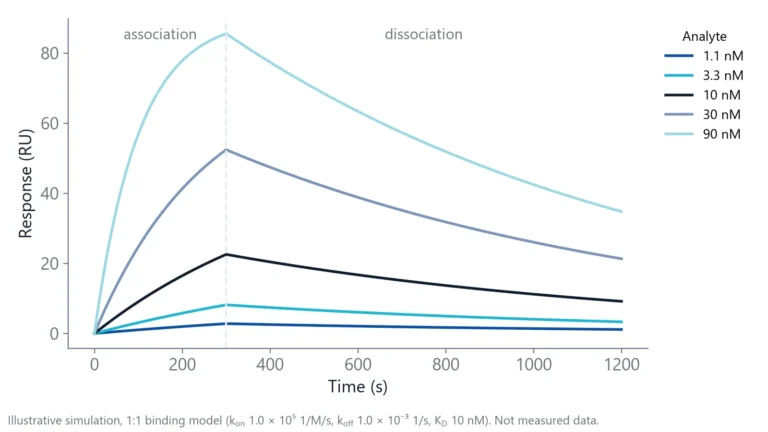 Dissociation constant (KD): what it tells you about bindingWhat a KD value means at the bench, why two binders with the same KD can behave very differently, and the checks that tell you whether a KD is real.Label-free 101
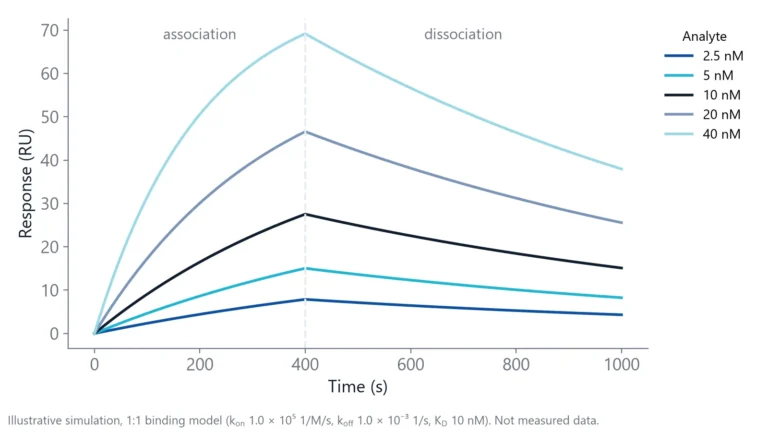 How to read a sensorgram: baseline, association, dissociationA sensorgram shows binding as it happens. Learn what each phase means, what the height and shape of the curve tell you, and which artifacts to remove before you fit.Method comparisons
 Biolayer interferometry vs SPR: which method fits your assayBoth methods measure binding label-free and in real time. The sample path, flow over a chip or a tip in a well, decides which one suits your hardest measurement.