
Label-free 101
The basics of label-free interaction analysis. What it measures, how a sensorgram is built, and what affinity and kinetics tell you about a binding event.
Label-free binding analysis measures an interaction directly, without a fluorescent or radioactive tag on either partner. The binding assay is read in real time as a sensorgram, which gives the on-rate, the off-rate and the affinity in one experiment.
New to the method? Start with how to read a sensorgram, then what the dissociation constant (KD) tells you and how KD differs from IC50.
3 articles in Label-free 101
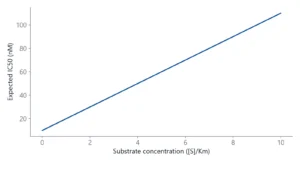 KD vs IC50: how binding affinity and inhibition differKD describes a binding pair, IC50 describes an inhibitor in one assay. Here is how they relate, when you can convert one into the other, and what kinetics add.
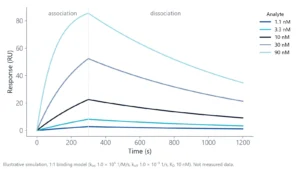 Dissociation constant (KD): what it tells you about bindingWhat a KD value means at the bench, why two binders with the same KD can behave very differently, and the checks that tell you whether a KD is real.
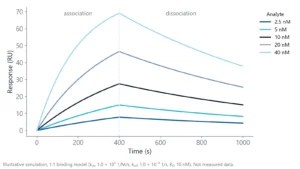 How to read a sensorgram: baseline, association, dissociationA sensorgram shows binding as it happens. Learn what each phase means, what the height and shape of the curve tell you, and which artifacts to remove before you fit.
Measured on inQuiQ
Application notes with real data from Delta's own lab.
WhitepaperReal-time, label-free NES analysis characterized PD-1/PD-L1 binding, delivering reproducible kinetic measurements with a KD of 37.7 nM.PD-1/PD-L1 InteractionWhitepaperLabel-free analysis quantified BMS-1166 inhibition of PD-1/PD-L1 binding, demonstrating dose-dependent inhibition with an IC₅₀ of 8.2 nM.PD-1/PD-L1 Inhibition with BMS-1166WhitepaperKinetic analysis of 250 Da small molecule interactions with Carbonic Anhydrase II using label-free sensing.Small Molecule Interactions
Have a question about this topic?
Tell an application specialist about your molecules and what you need to measure. You will get a straight answer on the setup that fits.