
On this page
Questions about your own assay?
Ask a specialistELISA binding affinity values are estimates that often disagree with other methods. Washes strip fast-dissociating complexes, bivalent antibodies on a coated plate report avidity, short incubations miss equilibrium, and excess coated partner hides the KD. Choose a format whose assumptions you can meet, vary incubation time and coating, and confirm kinetics with a real-time method.
Can ELISA measure binding affinity?
Yes, within limits. A carefully designed enzyme-linked immunosorbent assay (ELISA) can give an apparent equilibrium dissociation constant (KD): the concentration at which half of the binding sites are occupied. It cannot give the association rate constant (kon) or the dissociation rate constant (koff), and the value depends on the format. Treat an ELISA KD as an estimate you confirm.
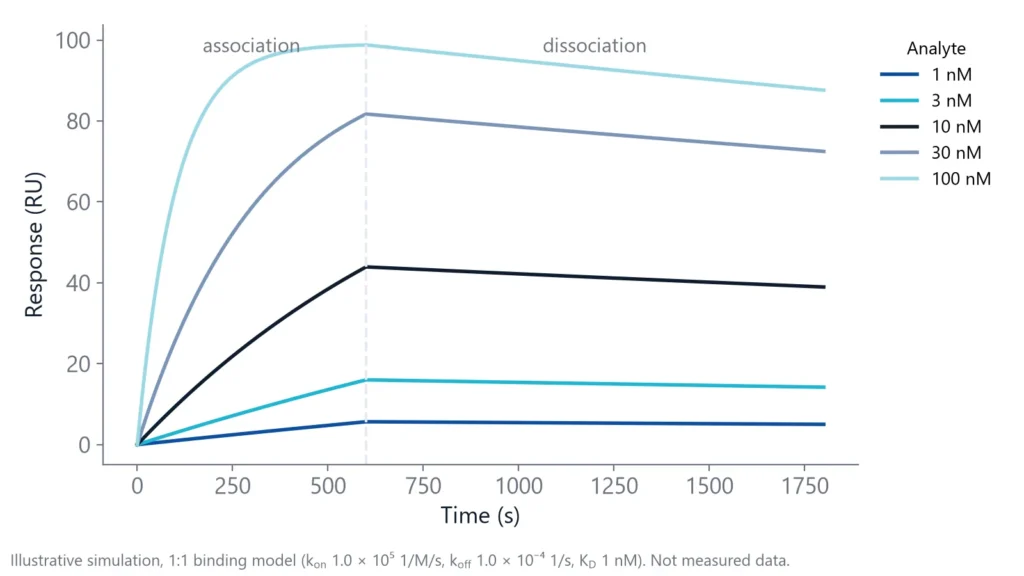
An ELISA detects a bound partner with an enzyme-labeled reagent after several incubation and wash steps, and reads one signal per well at the end [1]. Binding, however, is a time course. An antibody with a kon of 1e5 1/M/s and a koff of 1e-4 1/s has a KD of 1 nM, and its binding looks like the curves below. Each well reduces such a curve to a single point.
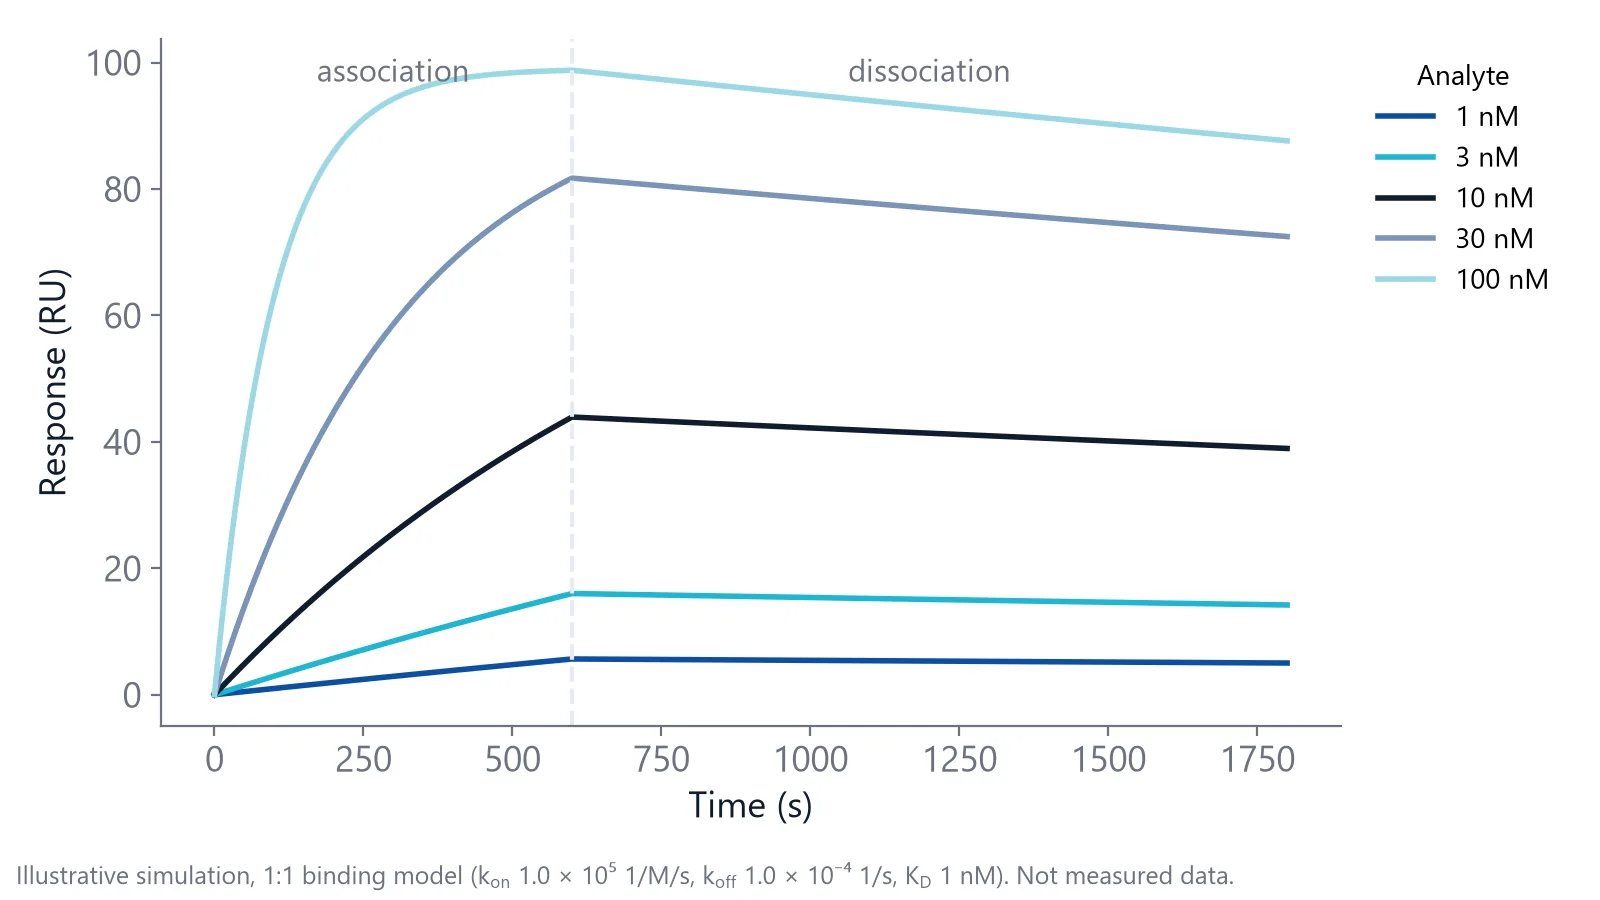
inQuiQ and other real-time label-free biosensors record the whole curve; inQuiQ reports KD, kon and koff.
Four ELISA formats that give an affinity value
Each format turns signal into KD through a different assumption.
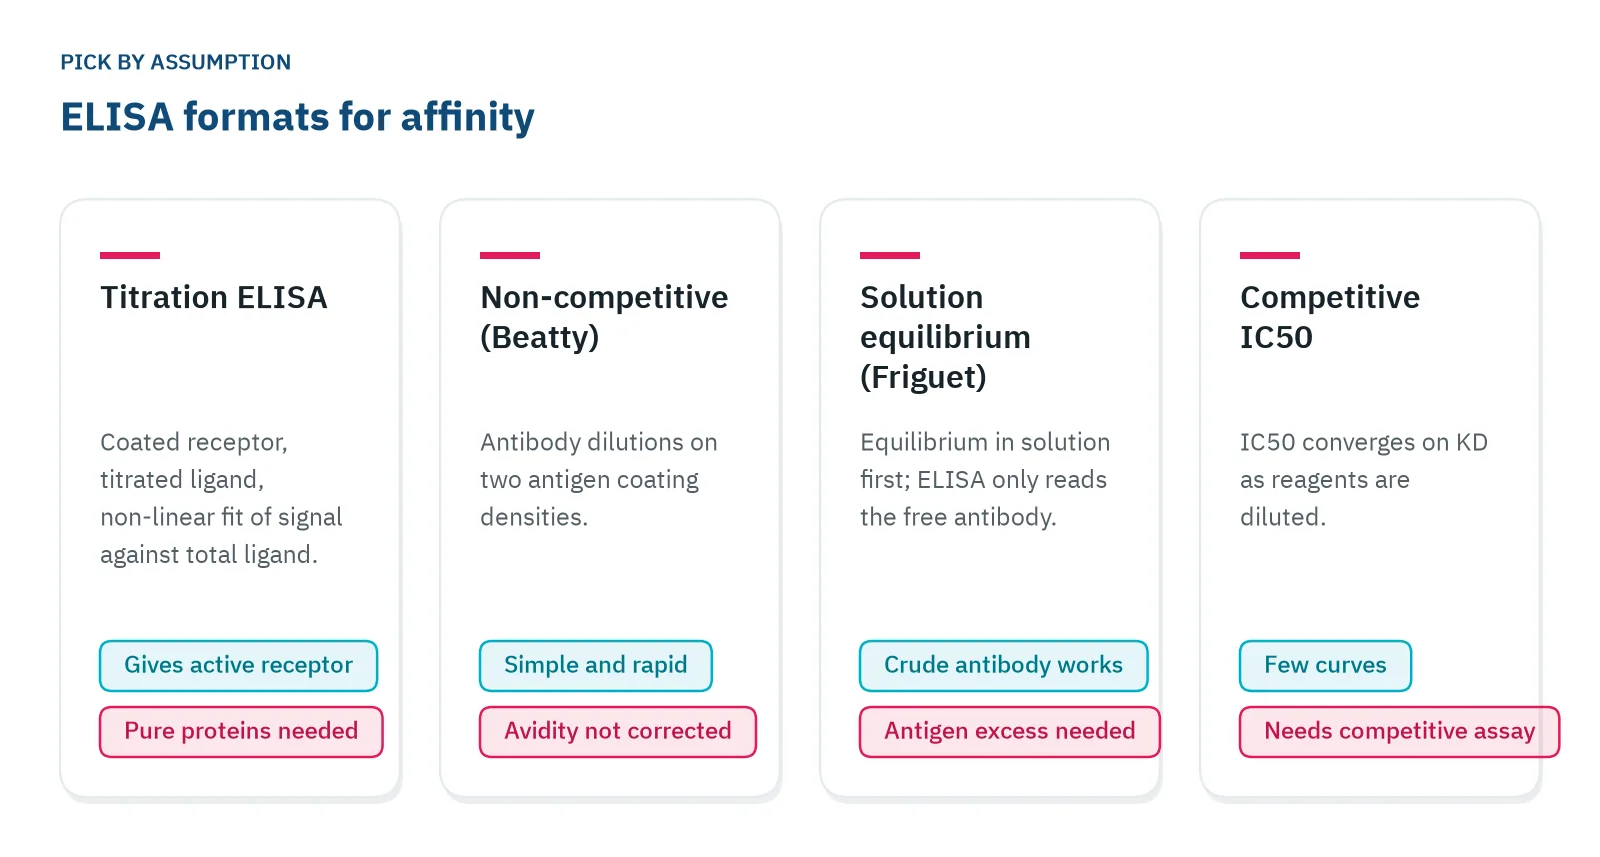
- Titration ELISA: coat the receptor, titrate the ligand and fit the signal against the total ligand added. A non-linear fit gives KD and the concentration of binding-active receptor, but both proteins must be pure and their concentrations known [2].
- Non-competitive (Beatty): dilute the antibody over plates coated at two antigen densities, one half the other, and calculate the affinity from the antibody concentrations at half-maximal signal [3].
- Solution equilibrium (Friguet): mix antibody and antigen in solution until equilibrium, then measure the antibody that is still free with an indirect ELISA. Antigen must be in large excess over antibody. Crude antibody preparations work, and neither partner needs a label [4].
- Competitive IC50: the IC50 of a competitive assay moves toward KD as you dilute the reagents. A two-dimensional dilution series shows when the values converge, sometimes with only four or nine curves [5].
The solution format measures binding before anything touches the plate, so it avoids most surface effects. It has worked even for antigens as large as viruses [6].
ELISA binding affinity values drift for four reasons
Washes remove fast-dissociating complexes
Every wash and detection step is a dissociation phase you never see. Processing steps between incubation and readout can change the amount of complex that was there at equilibrium [7].
A koff of 0.01 1/s means a half-life of about 70 seconds. After a one-hour detection step, almost none of that complex is left. Fast, weak binders look weaker than they are, or disappear.
Bivalent antibodies on a coated plate report avidity
An IgG has two arms. On a densely coated plate both can bind, and the complex holds on far longer than one arm alone. This apparent affinity, called avidity, is higher than the single-site affinity [1].
In one comparison, solid-phase assays gave affinity constants 1.5 to 5.4 times higher than solution assays for the same antibodies, a difference consistent with avidity, though the abstract names no single cause [6]. The non-competitive format does not correct for the multivalency of adsorbed antigen [5].
Short incubations miss equilibrium
An equilibrium constant needs equilibrium. Equilibration is slowest at the lowest concentration and for complexes with a low koff [7].
Take the 1 nM antibody from Figure 1. With a koff of 1e-4 1/s, its complex has a half-life of about 2 hours, so the lowest-concentration wells need around five half-lives, or 10 hours. Yet in a survey of published binding studies, nearly 90% of incubation times were one hour or less [7].
Too much coated partner hides the KD
Half-maximal signal equals KD only when the fixed partner is well below the KD.
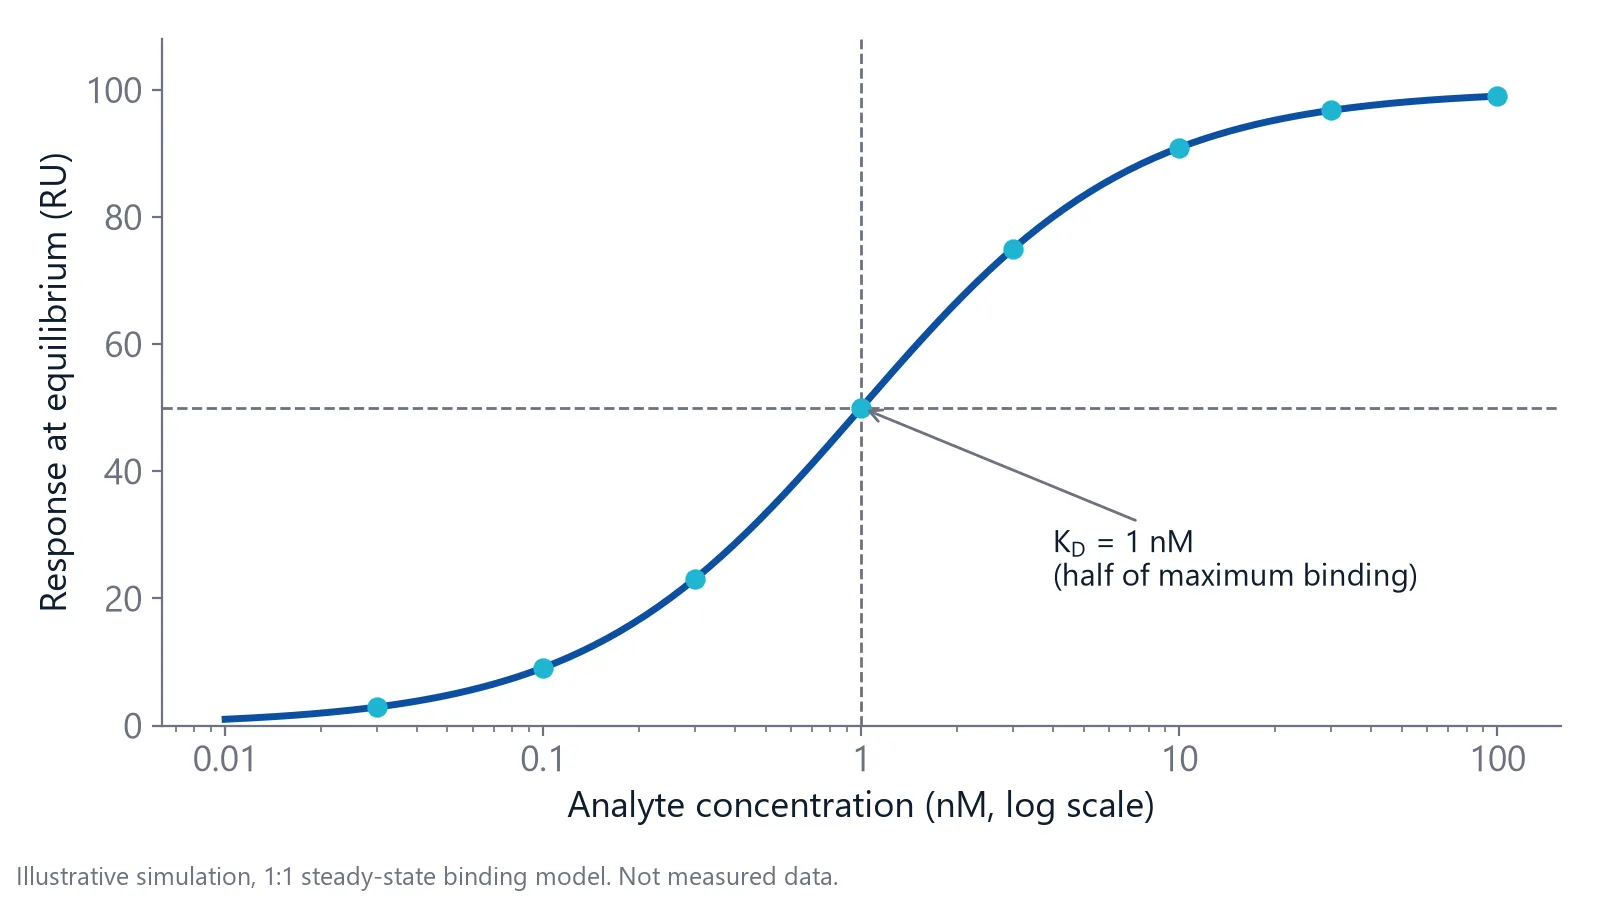
If the fixed partner is far above the KD, the half-maximal point reflects half the active binding sites instead, which can be off by orders of magnitude. A fixed partner up to about 10 times the KD still gives a usable KD with typical data [7]. On a plate, the coated partner is the fixed one, and its active concentration is rarely known.
Run these checks before you report an ELISA KD
- Vary the incubation time at least 10-fold and confirm that the signal at the lowest concentration no longer changes [7].
- Lower the concentration of the fixed partner and repeat. If the apparent KD moves with it, you are not in the binding regime [7].
- Run a Fab fragment next to intact IgG. In a solution equilibrium ELISA, Fab' gave the same constant as a classical solution assay, while intact IgG gave values about 30% lower [6].
- Fit the full curve with a defined binding model and check the fit over the whole range. A poor fit means you need more controls [7].
- Confirm the value with an independent method, ideally a kinetic one [7].
Report the format, coating concentration, timing and temperature with every ELISA binding affinity value. Affinity constants are operational: compare antibodies only within one technique under standardized conditions [6].
How does ELISA compare with real-time binding measurement?
When the controls are in place, an ELISA binding affinity value can match a real-time measurement closely. What ELISA cannot add is the time course: how fast the complex forms, how long it lasts and whether binding happens in one step. Real-time label-free biosensors measure those directly.
For one monoclonal antibody against horseradish peroxidase, a time-course ELISA gave a KD of 4.6 nM, a Beatty analysis 4.8 nM and surface plasmon resonance (SPR) 4.3 nM [8]. Nanophotonic Evanescent field Sensing (NES) works on the same principle as SPR: binding changes the refractive index inside an evanescent field at the sensor surface.
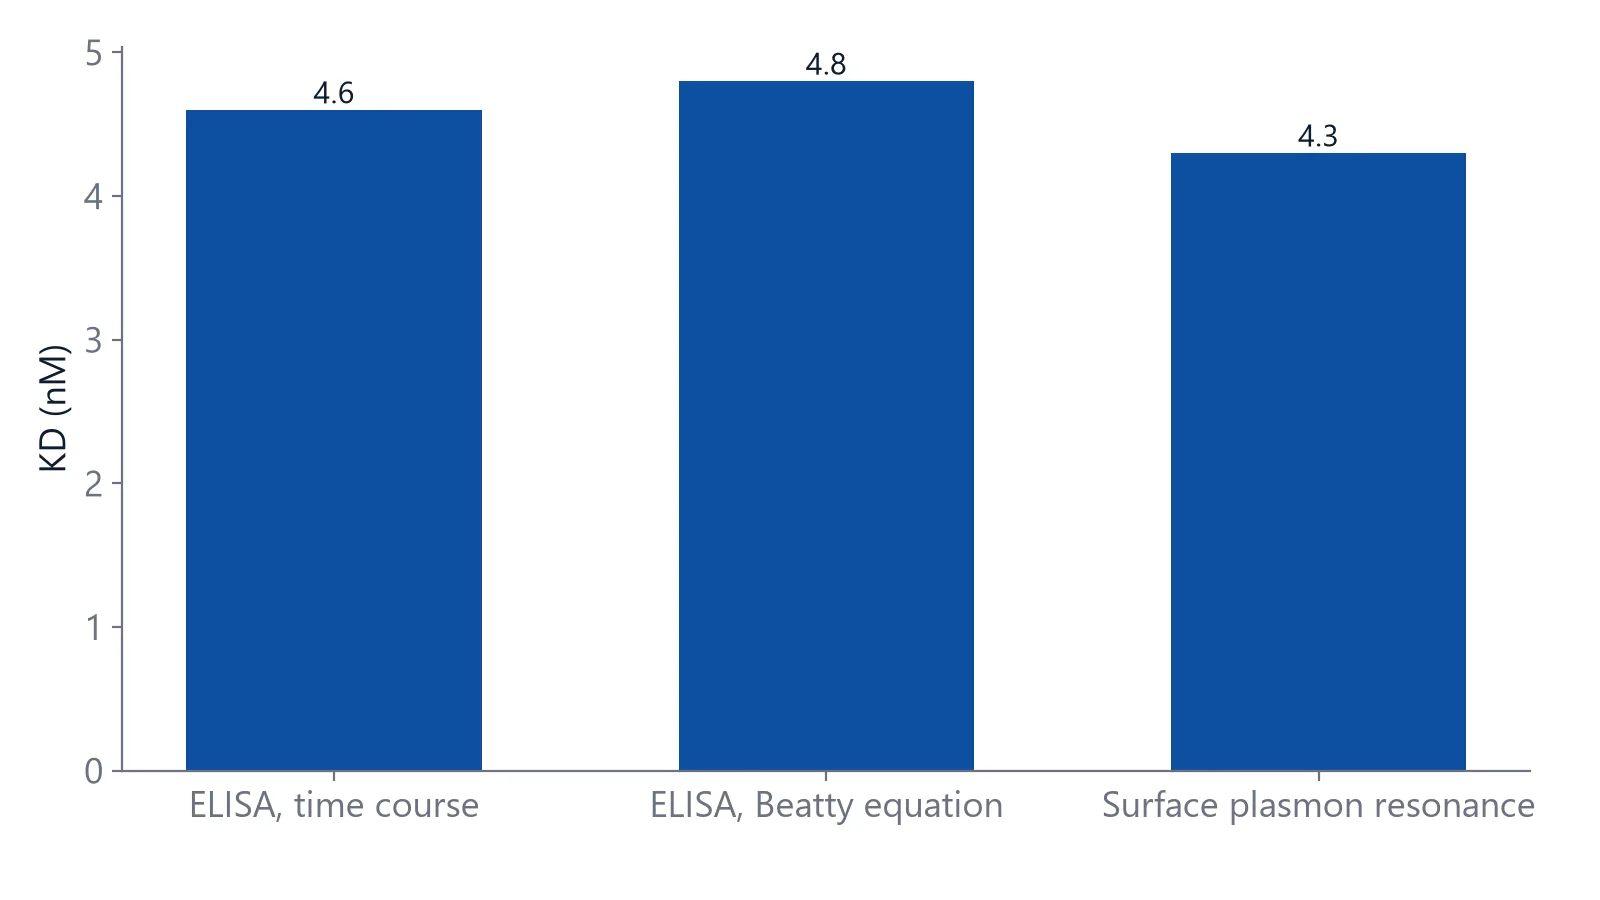
Values can also differ for good reasons. In another antibody study, ELISA revealed two KD values about 100-fold apart, from a weak first complex followed by a conformational change, while the real-time label-free method reported one value or an average, depending on the setup [9]. The methods saw different parts of the same interaction.
The table compares endpoint ELISA with real-time label-free methods: SPR, biolayer interferometry (BLI), grating-coupled interferometry (GCI) and NES.
| Endpoint ELISA | Real-time label-free (SPR, BLI, GCI, NES) | |
|---|---|---|
| What you read | One signal per well after washes [1] | Binding over time, during association and dissociation |
| Kinetics | No kon or koff | kon, koff and KD from one data set |
| Label | Enzyme-labeled detection reagent | None |
| Equipment | Plate reader, standard plates | Biosensor instrument and sensor surfaces |
| Main limits | Washes, avidity, unknown coated concentration | Immobilization effects, non-specific binding, bulk refractive index shifts, avidity on antigen-coated surfaces |
On a biosensor you can avoid avidity by capturing the bivalent antibody and flowing the monovalent antigen over it: a bivalent ligand behaves as two independent sites [1]. Delta supplies sensor chips with Protein A and Protein G surfaces for this antibody capture.
When ELISA is still the right tool
ELISA stays a good choice when you need a relative answer from many samples, on equipment every lab has.
- Ranking antibodies or variants against each other with one format under fixed conditions [6]
- Tracking avidity maturation in serum with an avidity index that adds a chaotrope such as urea or potassium thiocyanate [10]
- Estimating KD from crude antibody preparations with the solution equilibrium format [4]
- Measuring antibodies against haptens and other monovalent antigens with a competitive assay [5]
For an avidity index, keep the protocol and temperature fixed, because both change the index [10].
Move to real-time measurement when the question is about kinetics: residence time, fast-dissociating binders that washes remove, or clones with the same KD but different kon and koff. Two interactions with the same KD can need equilibration times that differ by orders of magnitude [7], and only a time course shows which one you have.
For antibody programs, see how antibody affinity and kinetics are characterized label-free.
Questions researchers ask
Can I measure the affinity of polyclonal serum by ELISA?
Serum contains many antibodies with different affinities and epitopes, so any single value is an average weighted by their concentrations and by avidity, rather than a true KD. Clones with very different affinities can contribute equally to the signal, so the same average can hide a wide spread. Report it as a relative value.
Is the EC50 from a direct ELISA the same as KD?
Only under strict conditions. The EC50 is the antibody concentration that gives half-maximal signal under your conditions, and it shifts with coating density, timing and detection reagent. It also depends on where the signal plateaus. Run the checks above before reading it as a KD.
What is the difference between Ka and KD?
Ka is the association constant, in 1/M. KD is the dissociation constant, in M, and equals 1 divided by Ka. Older ELISA papers often report Ka or Kaff. A Ka of 1e9 1/M equals a KD of 1 nM. Convert values to the same constant before you compare them across papers.
Can coating the plate change the affinity I measure?
Yes. Passive adsorption to polystyrene can partly unfold a protein or hide its epitope, so part of the coated antigen no longer binds. That lowers the active surface concentration and can bias the fit. Capturing the antigen through a tag or biotin, or using the solution equilibrium format, reduces this risk.
References
- Real-Time Analysis of Biomolecular Interactions. Springer Japan. 2000. doi:10.1007/978-4-431-66970-8
- Eble JA. Titration ELISA as a Method to Determine the Dissociation Constant of Receptor Ligand Interaction. J Vis Exp. 2018. doi:10.3791/57334
- Beatty JD, Beatty BG, Vlahos WG. Measurement of monoclonal antibody affinity by non-competitive enzyme immunoassay. J Immunol Methods. 1987. doi:10.1016/0022-1759(87)90187-6
- Friguet B, Chaffotte AF, Djavadi-Ohaniance L et al.. Measurements of the true affinity constant in solution of antigen-antibody complexes by enzyme-linked immunosorbent assay. J Immunol Methods. 1985. doi:10.1016/0022-1759(85)90044-4
- Fischer J, Kaufmann JO, Weller MG. Simple Determination of Affinity Constants of Antibodies by Competitive Immunoassays. Methods Protoc. 2024. doi:10.3390/mps7030049
- Azimzadeh A, Pellequer JL, Van Regenmortel MH. Operational aspects of antibody affinity constants measured by liquid-phase and solid-phase assays. J Mol Recognit. 1992. doi:10.1002/jmr.300050103
- Jarmoskaite I, AlSadhan I, Vaidyanathan PP et al.. How to measure and evaluate binding affinities. Elife. 2020. doi:10.7554/eLife.57264
- Toraño A, Moreno I, Infantes JA et al.. Description of a non-competitive ELISA based on time course analysis of ligand binding at saturation, and a direct method for calculating the affinity of monoclonal antibodies. J Immunol Methods. 2024. doi:10.1016/j.jim.2024.113756
- Heinrich L, Tissot N, Hartmann DJ et al.. Comparison of the results obtained by ELISA and surface plasmon resonance for the determination of antibody affinity. J Immunol Methods. 2010. doi:10.1016/j.jim.2009.10.002
- Portilho AI, Santos JS, Trzewikoswki de Lima G et al.. Study of avidity-ELISA: Comparison of chaotropic agents, incubation temperature and affinity maturation after meningococcal immunization. J Immunol Methods. 2023. doi:10.1016/j.jim.2022.113387
Keep reading
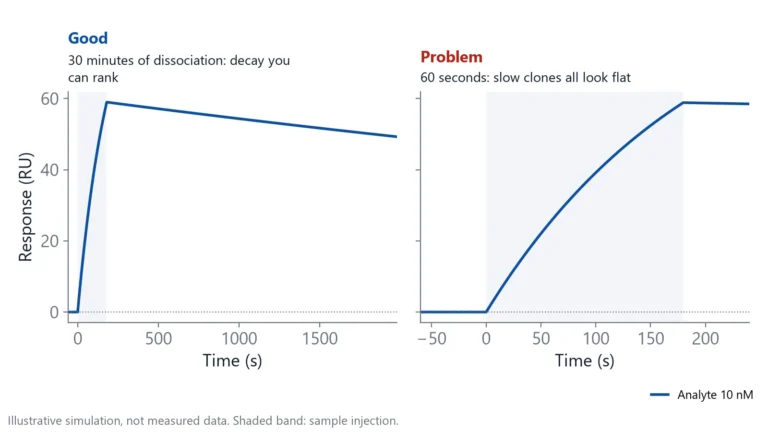 Antibody clone screening: from ELISA hits to off-rate rankingAn ELISA tells you which clones bind, not which ones hold on. How to rank hybridoma and library clones by off-rate straight from supernatant, and when ELISA is still the right first step.Switching from ELISA
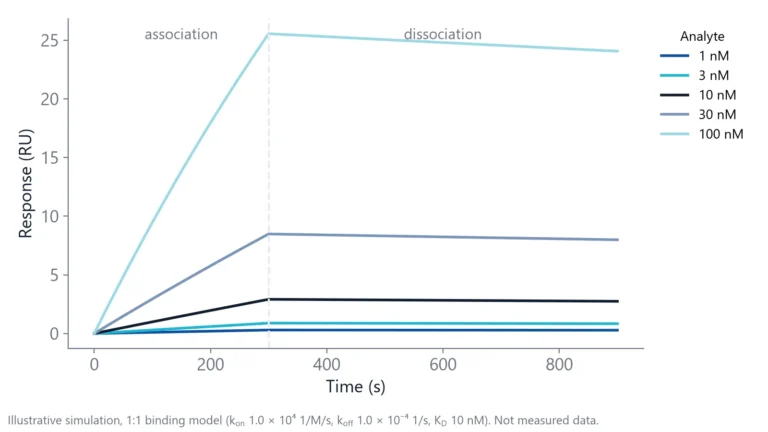 An alternative to ELISA when you need affinity and kineticsELISA shows what stayed bound after the washes. If you need affinity and binding rates, here is what to use instead, what changes in your workflow, and when the plate is still the better tool.Method comparisons
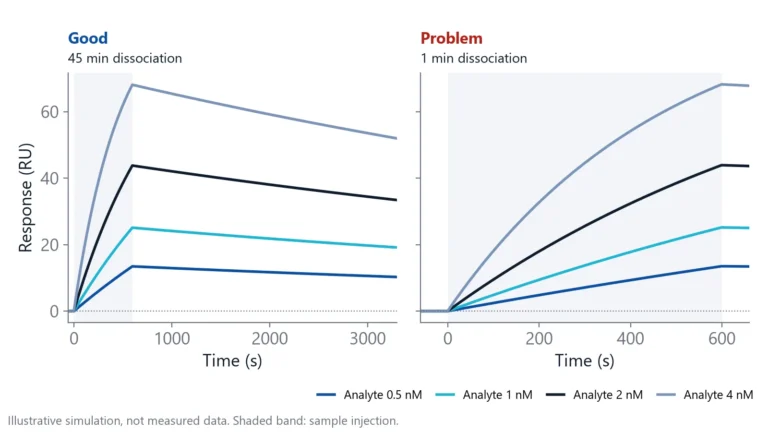 Biolayer interferometry vs SPR: which method fits your assayBoth methods measure binding label-free and in real time. The sample path, flow over a chip or a tip in a well, decides which one suits your hardest measurement.